Standard deviation
https://www.mathsisfun.com/data/standard-deviation-formulas.html
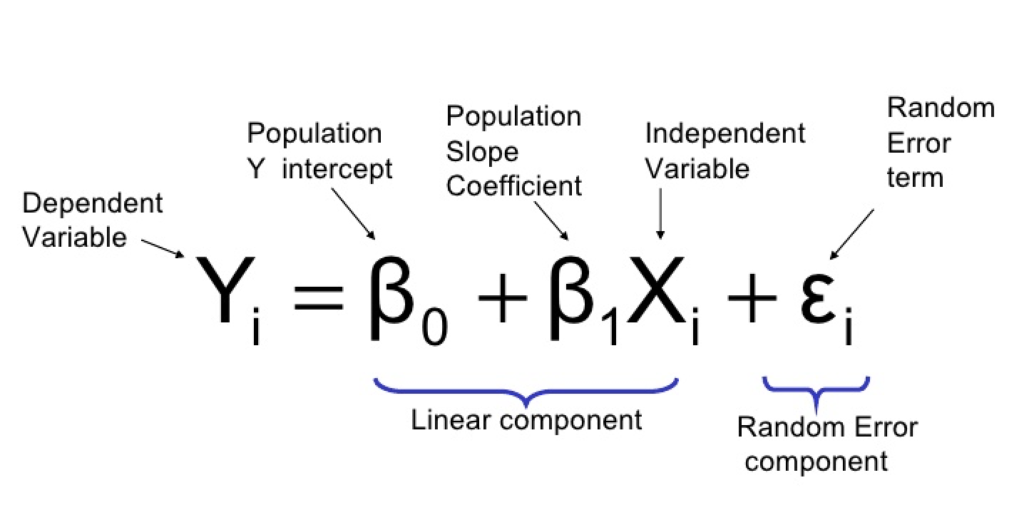
Linear regression
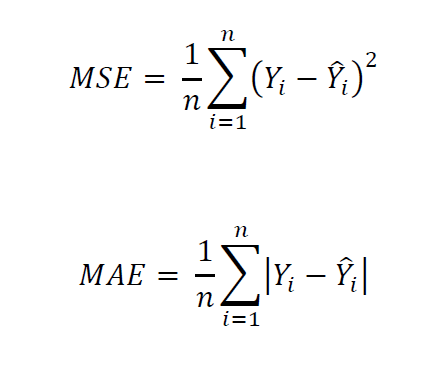
Mean squared error
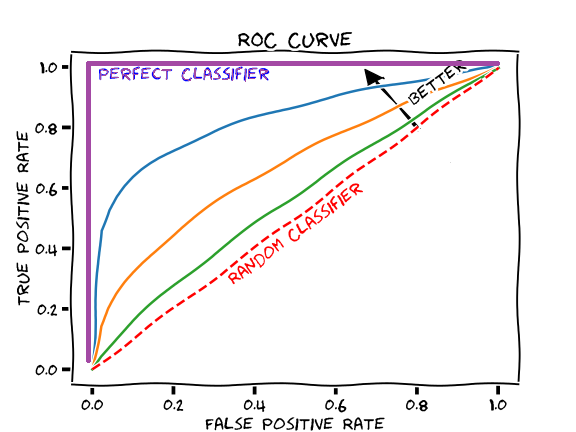
Understanding AUC and ROC
Correlation and Covariance
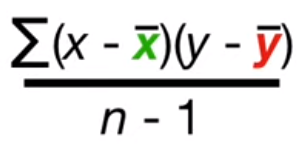
Pearson Correlation
Spearman Correlation
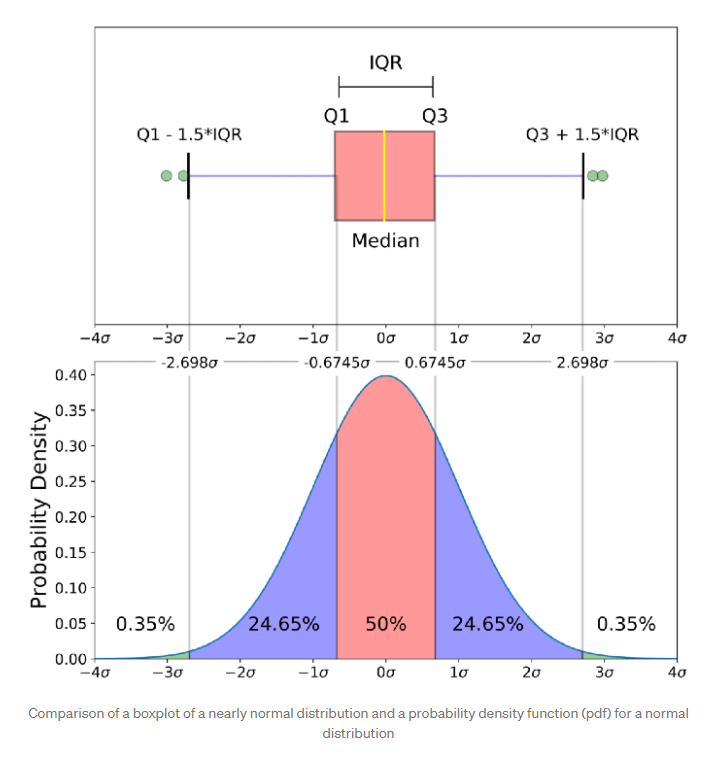
Understanding Box Plots
The easiest way to understand a boxplot is to visualize what it looks like on a starndard distribution dataset.
Vector Auto Regression
AIC & BIC
Bayes
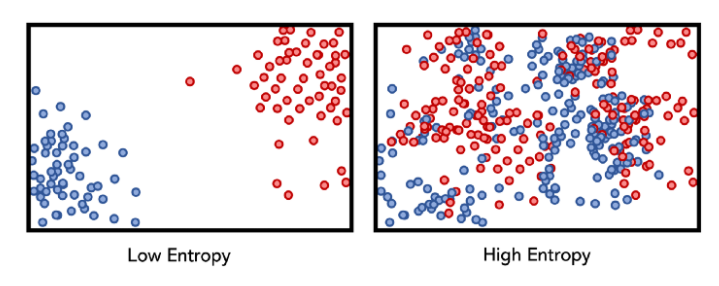
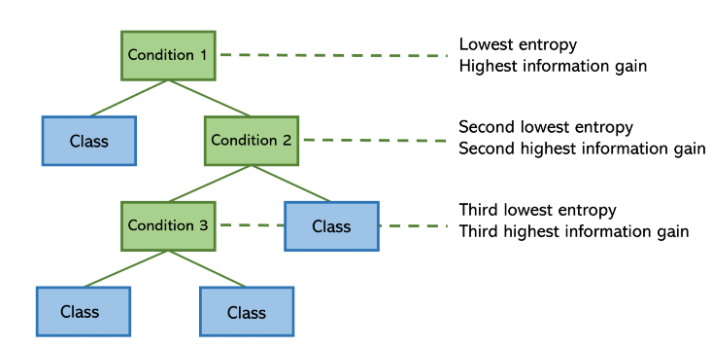
Entropy
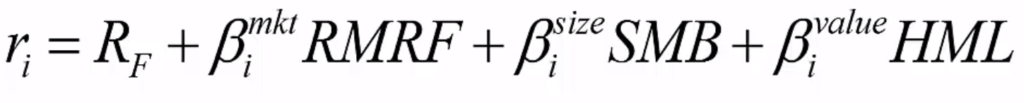
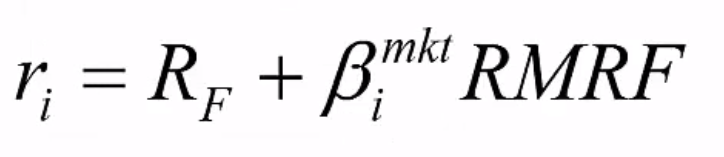
CAPM
Understanding factor based investing – https://www.morningstar.com/articles/636847/understanding-factor-models
Fama French 3 factor model