Arizona Real Estate October 2022

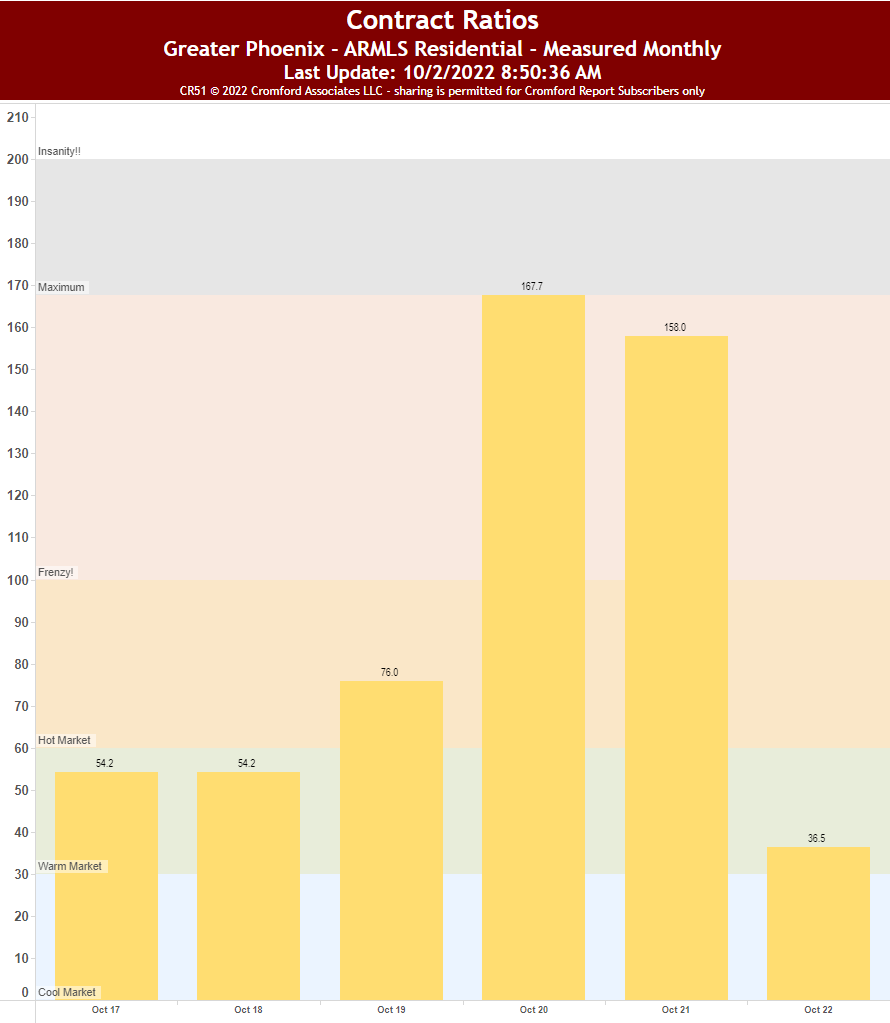
The real estate market hasn’t only cooled but it appears to be pretty frozen. What I’m looking at is the contract ratio. This essentially is the number of houses under contract divided by the number of active listings on the market. First, let’s look at October compared to previous Octobers going back to 2017. Houses under contract represent 36.5% of the entire inventory. It hasn’t been this low in at least 5 years.

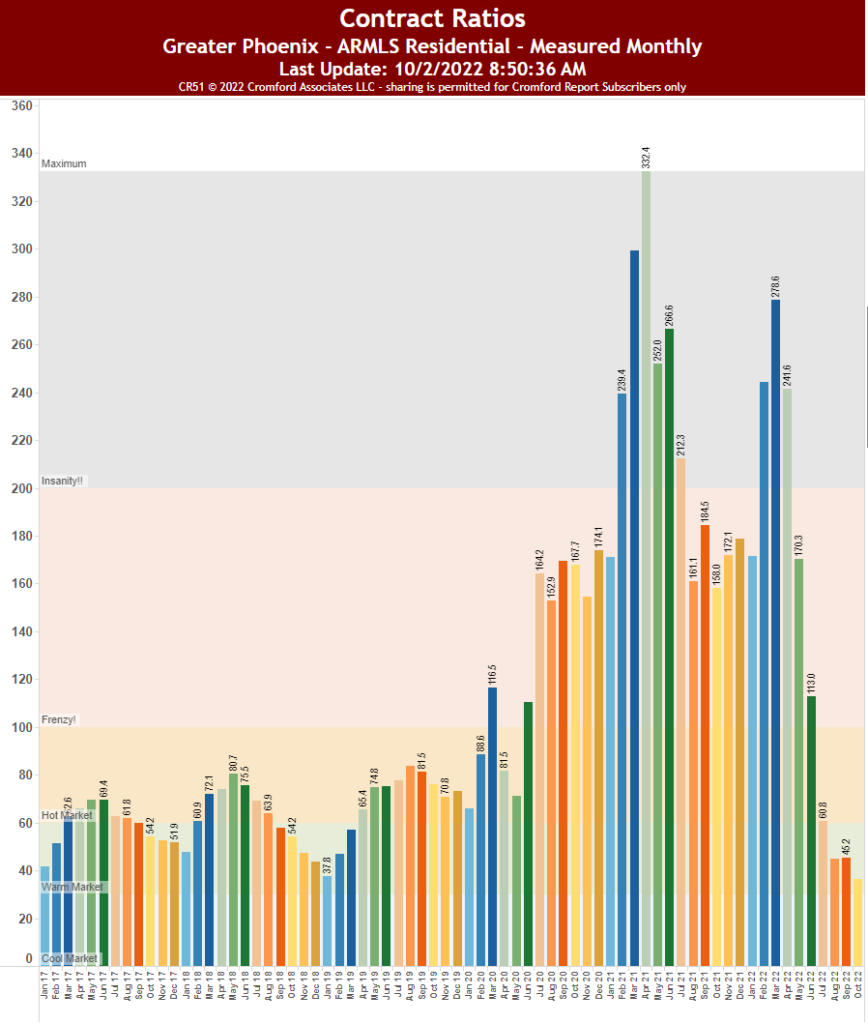
To put this in perspective, relative to the last couple of years, the peak was 332.4% of houses under contract relative to the number of active listings. Meaning, for every 3 houses under contract there was only 1 actively listed. This is a huge shift. But not only is this a huge shift it went from peak to trough at an alarmingly fast rate. This velocity is also relevant.

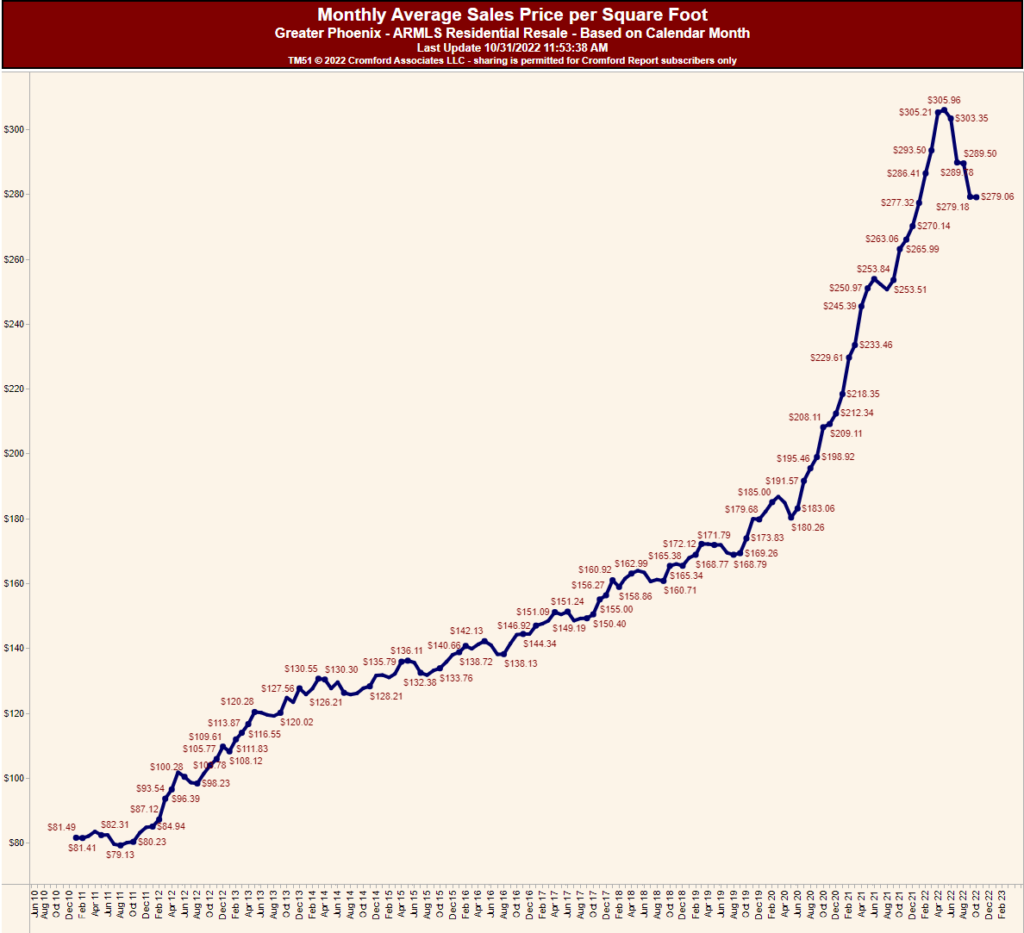
The average monthly sales price has seen a huge decline from $305.96 at its peak to $279.06 this is a 9% drop. Which doesn’t sound that bad. Except it happened in only 5 months. Again, the velocity is alarming.

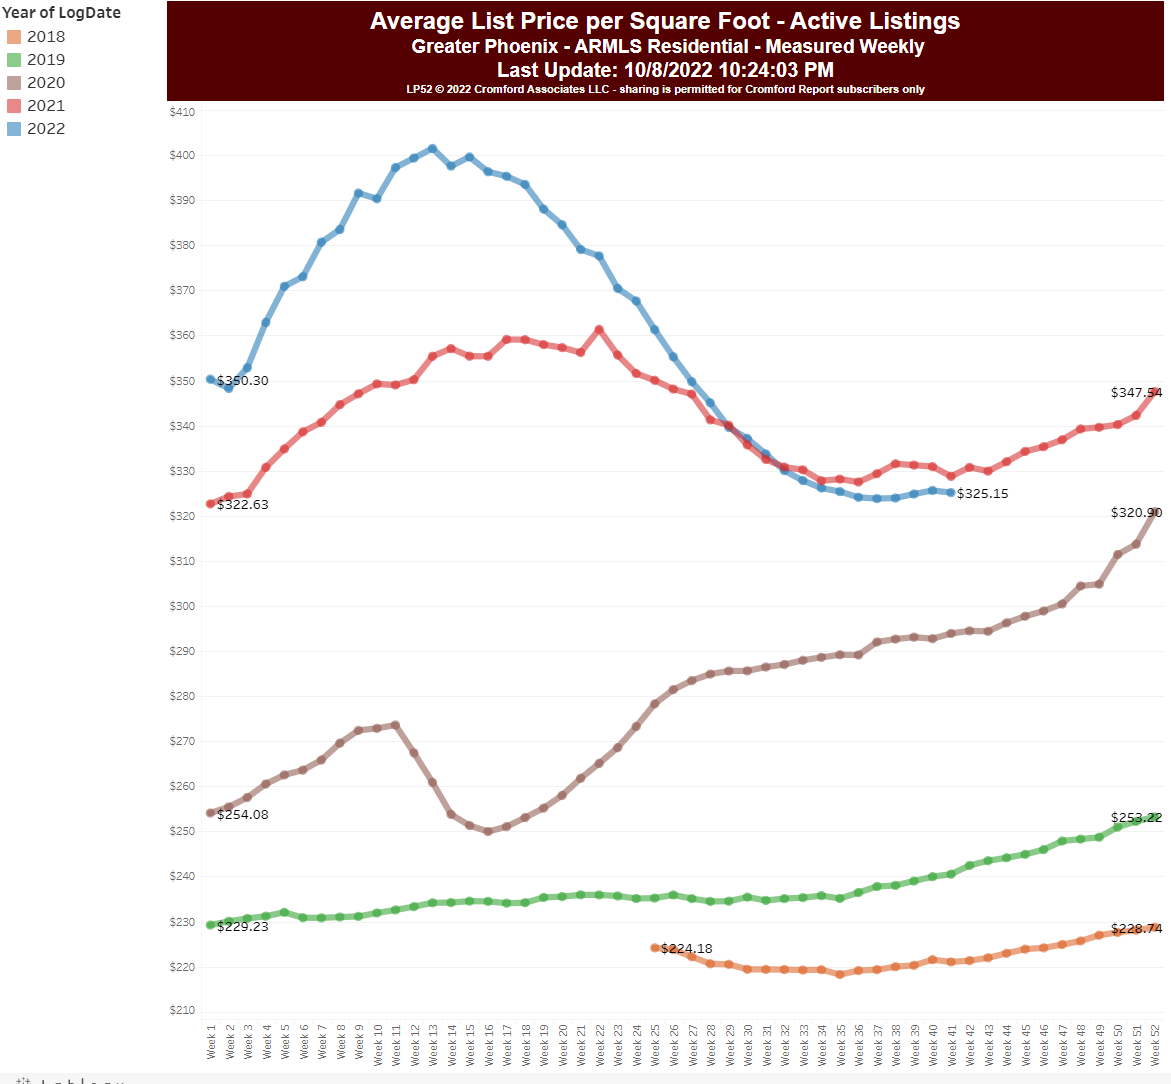
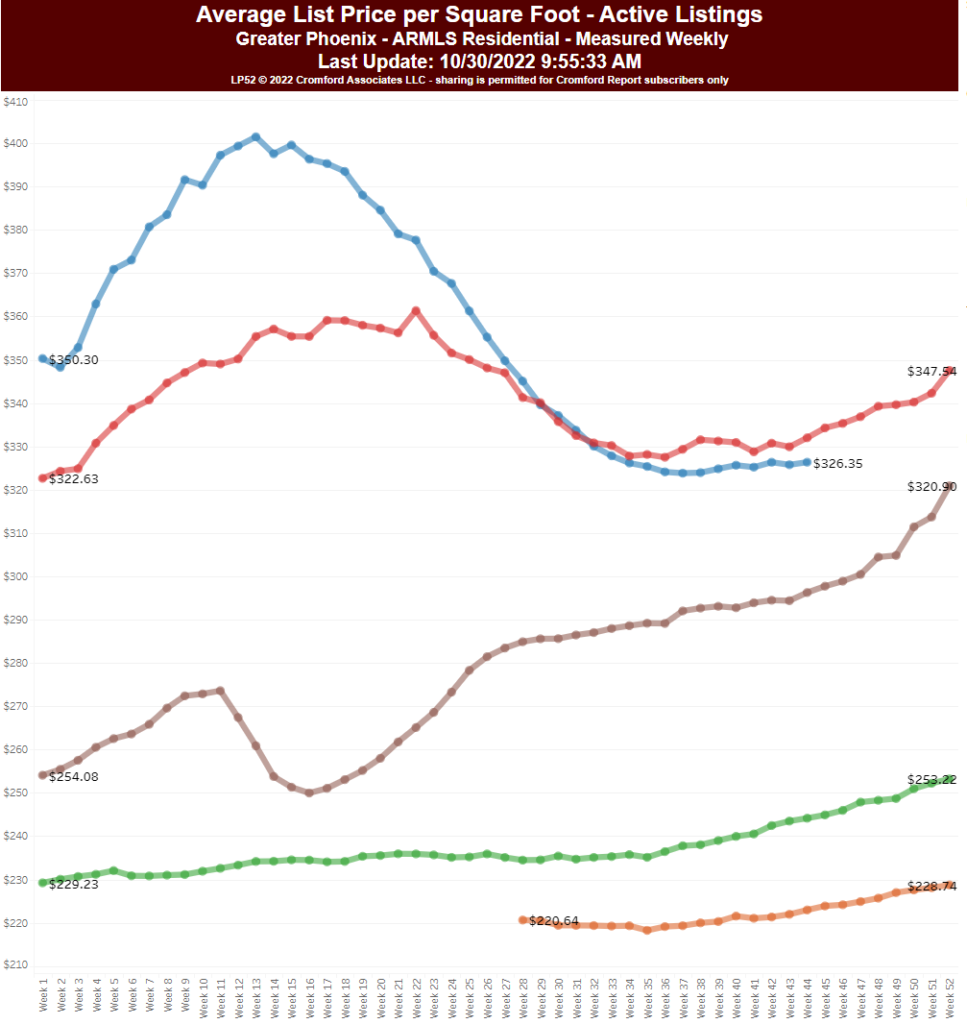
Even more interesting is the average person who is selling a house is still listing their house at $326 per square foot. This means the average person who is listing a house for sale right now is overpricing it by 14.4%. This is leading the market to stagnate. Which will eventually cause a build-up in supply and then a huge drop in prices as people who “need to sell” their houses start drastically lowering prices. This will create a massive psychological problem for anyone who is actively trying to sell their house. Not to mention the buyers will see the accumulation of price cuts and know the price isn’t as advertised. There will be room to send out lowball offers. Which some will take, causing comps to adjust and spiral downward.

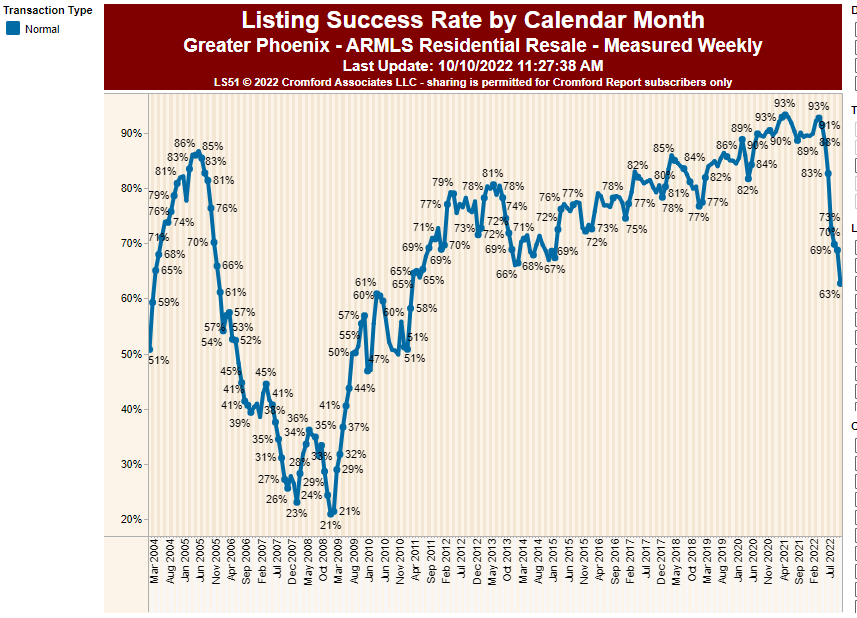
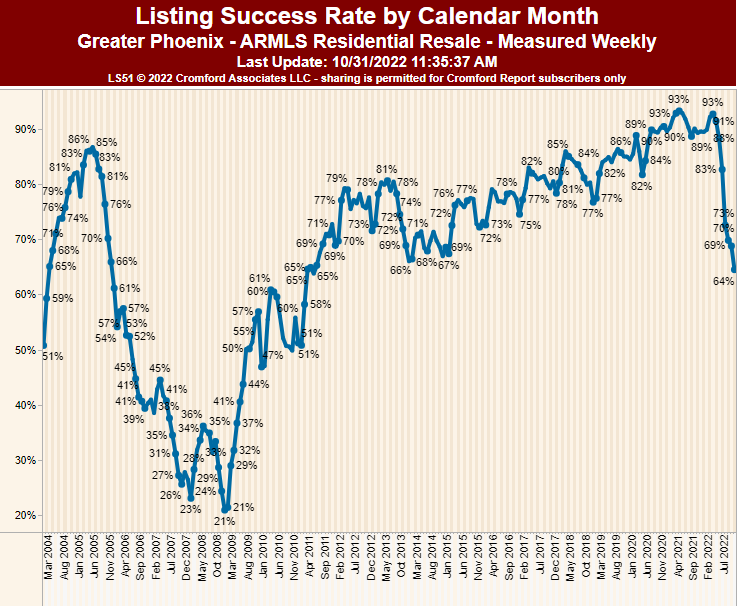
Let’s talk about the listing success rate. These are houses that actually sold rather than expired or cancel. In October of 2022, this number dropped to 64%. We haven’t seen these numbers since 2011. Grant it, there is one day left in the month…

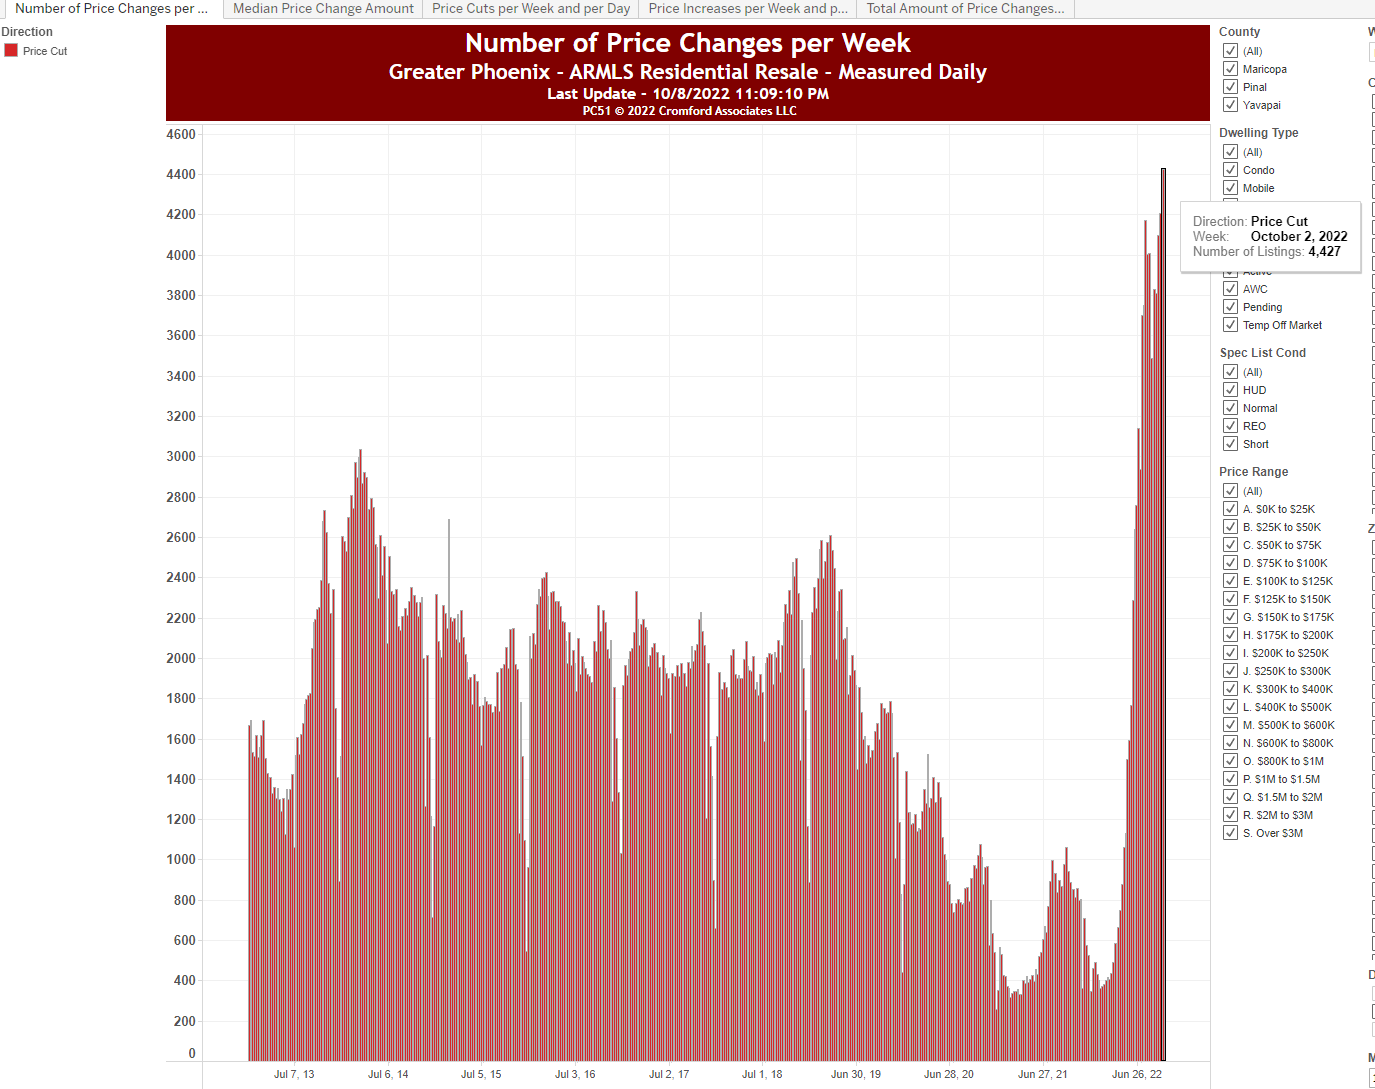
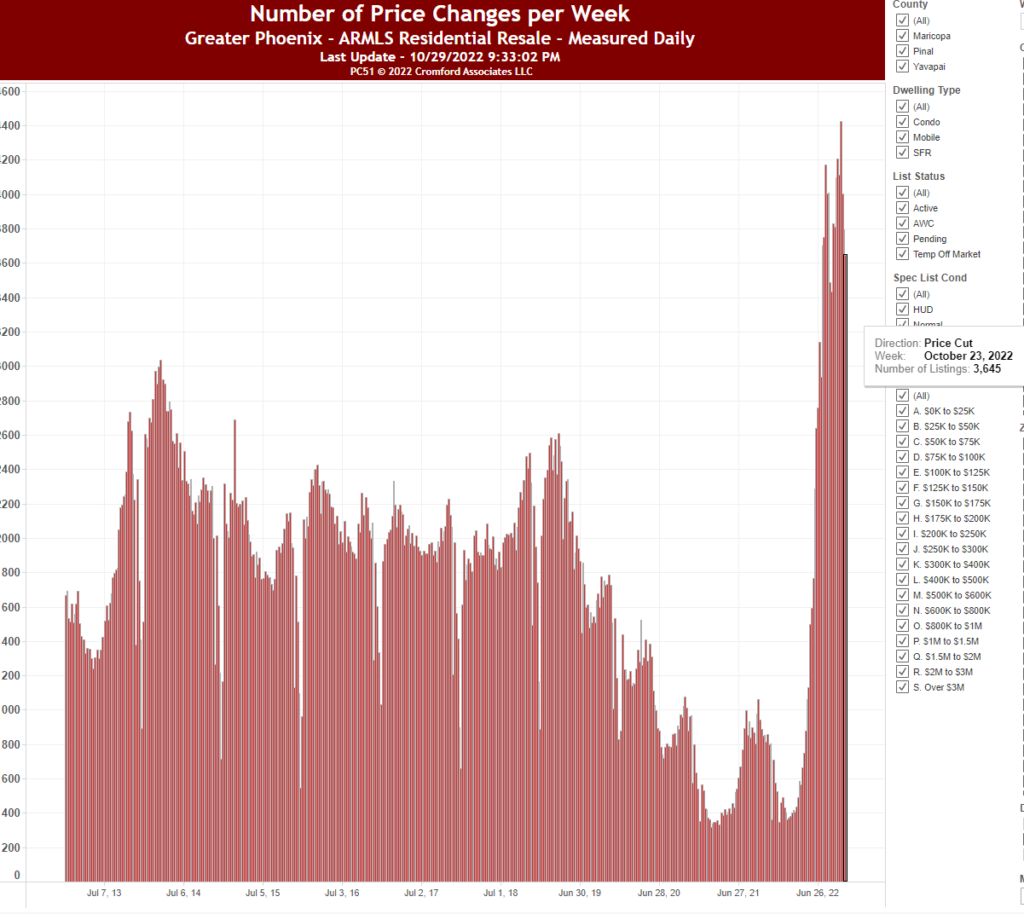
This brings me to my final chart for Arizona, price cuts per week. This chart is how you know the market in Arizona is getting annihilated. 3,645 people cut prices on their listings last week alone. There are only 19,587 active listings. This means 18.6% of all houses active in Arizona cut their prices last week and it’s not only last week. This is what it has been averaging almost every single week since the end of June. Again, it’s the psychological impact that is by far the most concerning thing here. Buyers are not going to pay “retail” prices when they see price cuts across the board. No market functions this way.

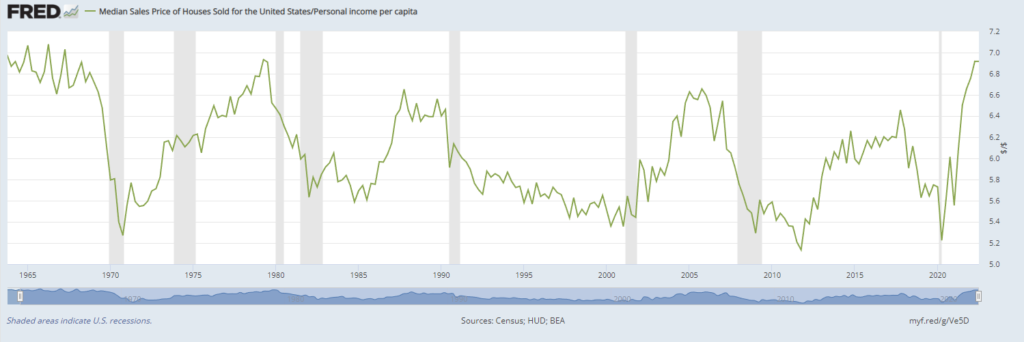
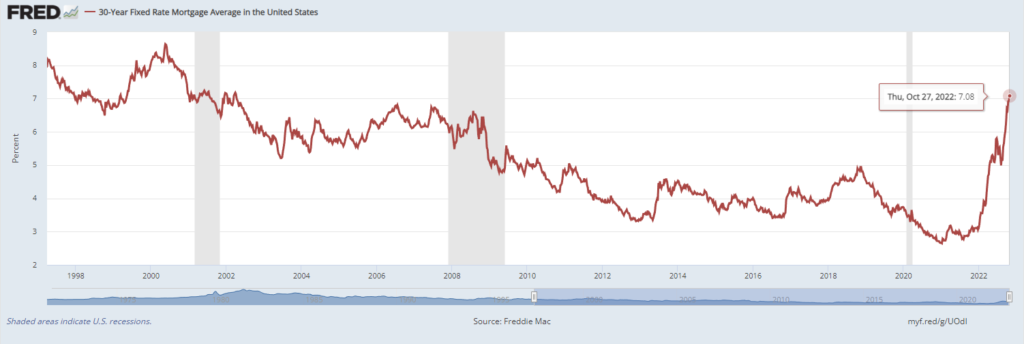
Let’s talk about the root cause of this. We all know because it’s been in the news. The Fed has had to raise rates to combat inflation. Which is 100% legitimate and far more dangerous threat to our economy. But I digress, mortgage rates haven’t been this high since 2001/2002. And let’s be clear the average buyer doesn’t care what they pay for a house. They care about their monthly payment.

So, let’s take a look at the median sales price of a house vs. income per capita. This oscillator in my opinion is by far the best predictor of if houses are too high or too low. This is the chart to watch if you’re investing in real estate.

Only 15 days left for 9.62% I-bonds

The new CPI report came out today. at a .43% monthly increase. This means I-bonds starting November first will only yield 6.472%

October 28th is the last day to purchase I-bonds at a 9.62% APY. Here are some things you need to know.

Yield

The 9.62% yield is only for the next 6-months. I-bonds get reassessed every 6-months. Therefore, to establish what your annual yield will be here is the simple math:

Yield until the end of October – 9.62%

Plus the yield starting in November – 6.472%

equals 8.05% for the next year.

More Complicated Yield

There are a couple of things to know about I-bonds.

If you cash out at exactly 1-year

You lose 3-months of interest if you cash out before 5 years. So your effective yield will be 8.05% minus 3.236% divided by 2 (only half the year) then divided by 2 again to get the 3-month yield equals 1.618%. Making your effective yield if you cashed out in 1-year 6.432%

More complicated formula

I-bonds actually compound semi-annually. So your first 6-month yield will be 9.62%. Let’s say you invest $10,000 (the maximum). After 6-months you will have $10,481. So the second half of the year you’re actually earning 6.472% on $10,481 not your original base of $10,000. So the second 6-moths you would net $339.17 + $10,481 ( your initial investment plus the first 6-months interest) This gives you an effective return of 8.2%, not the initially calculated 8.05% from our first formula.

Even more complicated

There is something else to keep in mind about I-bonds. They don’t actually need to be purchased until the second to last business day of the month. This means you essentially get a free month of earned interest! Even if you buy an I-bond on October 28th it is technically just an October I-bond. The date is not relevant. So it will actually mature on October 1st of the following year. Not the original date of purchase.

So the math for calculating this is just our original 8.2% divided by 12 to get our monthly yield of .68%. You can then multiply this by 12 and divide by 11 to determine the actual yield after 12 months given that you only invested for 11 months. This works out to be 8.95%

Can’t you only purchase $10,000 in I Bonds per year?

Yes, but no. Most people believe that you can only purchase $10,000 in I Bonds per year. This is in fact true. However, most people also do not realize or take advantage of the fact that LLCs can own and purchase $10,000 of I bonds per year. There are multiple references to I-Bonds being owned by LLCs on their website. In Arizona, it takes 5 minutes and $50 to set up an LLC.

Questions and Answers about Series I Savings Bonds

Treasury Direct entity accounts

You house isn’t worth what you think it is.

As I look over the real estate numbers in Arizona this week, I noticed that people are asking on average about 15% more than what houses sell for. In fact, we had 4,427 price cuts last week alone. This is 23% of the 19,225 houses available for sale.

You can see from the average sales price houses are selling for $277.51 they peaked in May at $305.96. So they are currently 9.3% off from their high.

Now here goes the issue. The average price people are listing their house for sale for is $325.15 or about 14.7% too high.

So what do they do? They slash prices. 23% of house prices were cut last week alone. This leads to the next problem. Buyers now know the sellers are “desperate” or at least willing to reduce their price. So they no longer want to pay the asking price. They know they can offer less. This is why we will continue to see prices going down and inventory going up. So there is the main driver of low prices, the FED raising rates, and the secondary driver, psychology.

To confirm you can see the listing success rate is plummeting. It is now back to levels we have not seen since 2010.

Listing Success Rate is the percentage of listings that closed with a sale rather than expiring or being canceled. It compares the number of listings sold This Month with the number of listings that were sold, expired or canceled in the same period. This percentage gives a useful indication of what percentage of terminated listings closed successfully.