
There is always discussion surrounding the trajectory of house prices. At the core of these debates lies the principle of consumer affordability, which is heavily influenced by monthly mortgage payments. I developed a Python program that models the interaction between house prices and mortgage interest rates, utilizing historical data from the FRED (Federal Reserve Economic Data) API.
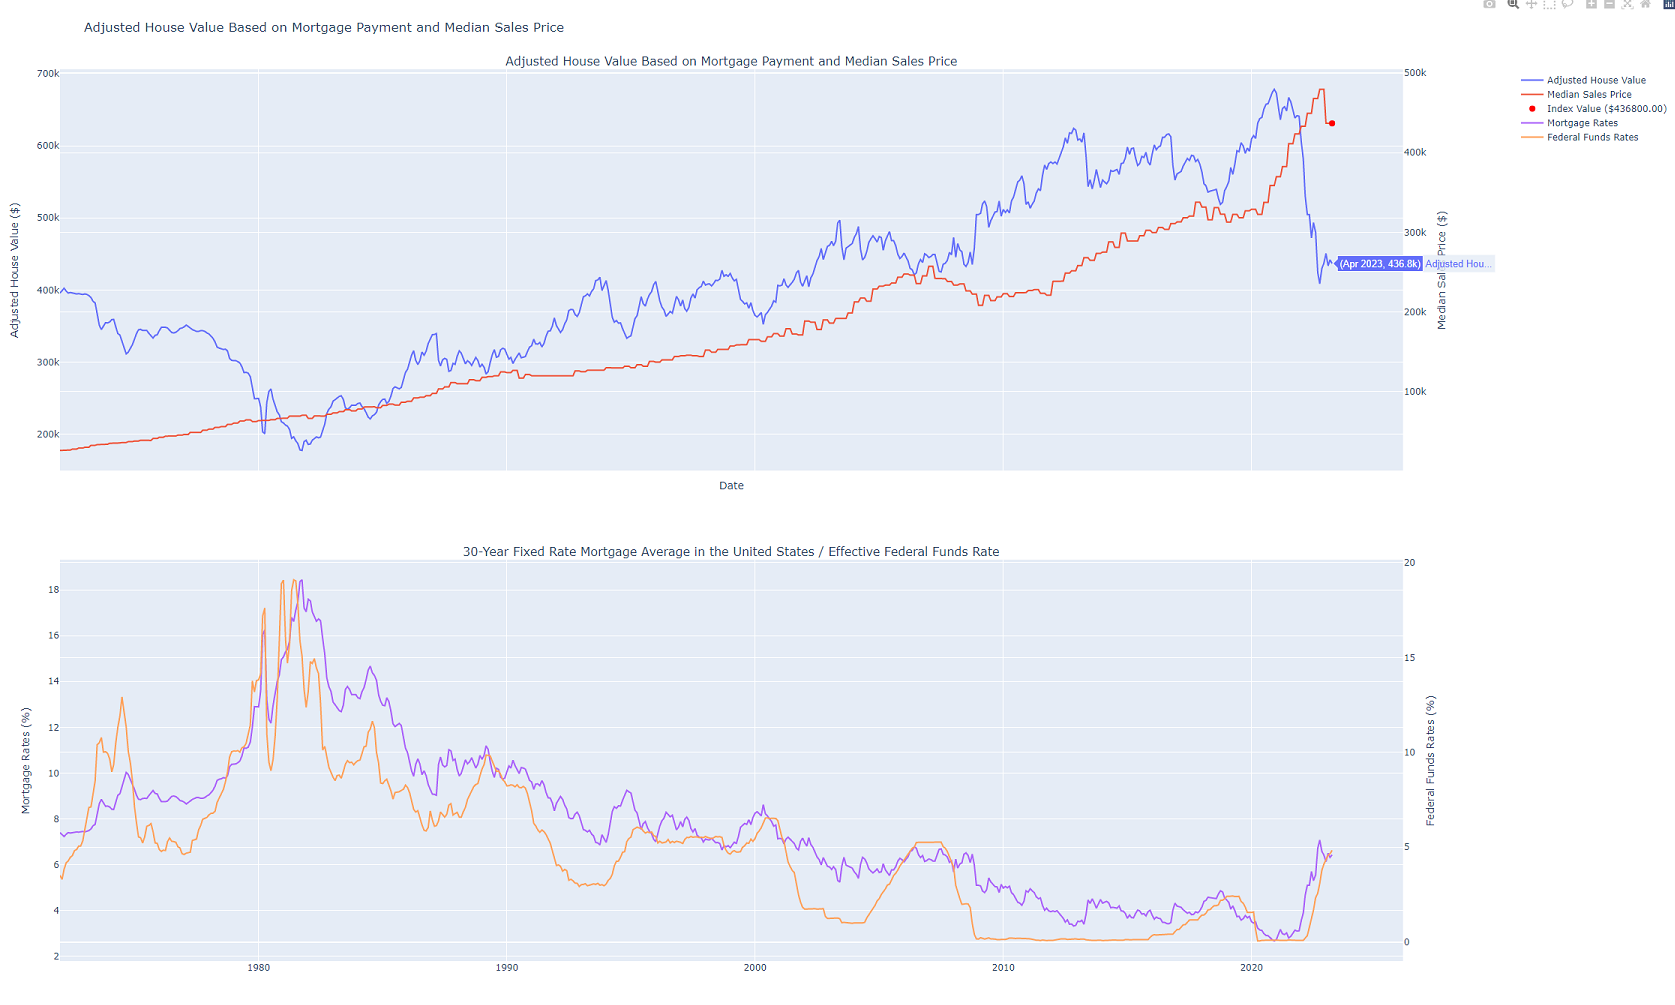
The program employs several functions to extract mortgage rates and average house price data from FRED, calculate monthly mortgage payments, and adjust house values based on interest rates. The final output is a chart illustrating the adjusted house values in relation to mortgage rates and median sales prices over time.
The Python code and the corresponding chart offer an in-depth tool for analyzing the impact of mortgage rates on house values and evaluating the sustainability of current market conditions. Based on the models the current median sales price is overvalued by ~38.4%
Code Overview:
The code is organized into several functions that fetch data from the FRED (Federal Reserve Economic Data) API, calculate monthly mortgage payments, and plot the adjusted house values. Here’s a brief overview of the main functions:
get_historical_mortgage_rates(): Fetches historical mortgage rates data from FRED.calculate_monthly_mortgage(): Calculates the monthly mortgage payment for a given price, year, and month.adjusted_house_value(): Calculates the house value for other dates based on the mortgage payment amount and interest rates.get_average_house_prices(): Fetches average house prices data from FRED.adjusted_house_value_median_sales_price(): Combines the adjusted house value calculations with the median sales price data and plots the results.
import datetime
import pandas as pd
from fredapi import Fred
from config import api_key
import datetime
import numpy as np
from dateutil.relativedelta import relativedelta
import plotly.graph_objs as go
import plotly.io as pio
import plotly.subplots as sp
import plotly.offline as pyo


def get_historical_mortgage_rates(api_key, series_id, start_date=None, end_date=None):
    fred = Fred(api_key=api_key)
    mortgage_rates = fred.get_series(series_id, start_date, end_date)
    mortgage_rates = pd.DataFrame(mortgage_rates).reset_index()
    mortgage_rates.columns = ["date", "rate"]
    mortgage_rates["year_month"] = mortgage_rates["date"].apply(lambda x: x.strftime("%Y-%m"))
    mortgage_rates_dict = mortgage_rates.set_index("year_month")["rate"].to_dict()
    return mortgage_rates_dict


def calculate_monthly_mortgage(price, year, month, mortgage_rate_data):
    # Create year-month string
    year_month = f"{year}-{month:02d}"

    # Find the corresponding mortgage rate for the given year and month
    if year_month in mortgage_rate_data:
        mortgage_rate = mortgage_rate_data[year_month]
    else:
        raise ValueError(f"No mortgage rate data found for {year}-{month}")

    # Calculate the monthly interest rate
    monthly_interest_rate = (mortgage_rate / 100) / 12

    # Calculate the number of payments for a 30-year mortgage
    num_payments = 30 * 12

    # Calculate the monthly mortgage payment using the formula
    # M = P [r(1 + r)^n] / [(1 + r)^n – 1]
    monthly_payment = price * (monthly_interest_rate * (1 + monthly_interest_rate) ** num_payments) / (
                (1 + monthly_interest_rate) ** num_payments - 1)

    return monthly_payment
def adjusted_house_value(price, index_date, mortgage_rate_data):
    # Calculate the mortgage payment for the given index date
    index_year = index_date.yearY
    index_payment = calculate_monthly_mortgage(price, index_year, index_month, mortgage_rate_data)

    # Calculate the house value for other dates based on the mortgage payment amount and the interest rates
    house_values = {}
    for year_month, rate in mortgage_rate_data.items():
        year, month = map(int, year_month.split('-'))
        date = datetime.date(year, month, 1)
        house_value = index_payment * ((1 + monthly_interest_rate)**num_payments - 1) / (monthly_interest_rate * (1 + monthly_interest_rate)**num_payments)
        house_values[date] = house_value

    # Plot the house values
    dates = sorted(house_values.keys())
    values = [house_values[date] for date in dates]

    # Create the plot using Plotly
    fig = go.Figure()

    fig.add_trace(go.Scatter(x=dates, y=values, mode="lines", name="Adjusted House Value"))

    # Mark the index date and value with a vertical dot
    index_value = house_values[index_date]
    fig.add_trace(go.Scatter(x=[index_date], y=[index_value], mode="markers", marker=dict(color="red", size=8), name=f"Index Value (${index_value:.2f})"))

    fig.update_layout(title="Adjusted House Value Based on Mortgage Payment", xaxis_title="Date", yaxis_title="House Value ($)")

    # Show the plot
    pio.show(fig)
    pyo.plot(fig, filename="output.html", auto_open=False)


def get_average_house_prices(api_key, series_id, start_date=None, end_date=None):
    fred = Fred(api_key=api_key)
    average_house_prices = fred.get_series(series_id, start_date, end_date)
    average_house_prices = pd.DataFrame(average_house_prices).reset_index()
    average_house_prices.columns = ["date", "price"]
    average_house_prices["year_month"] = average_house_prices["date"].apply(lambda x: x.strftime("%Y-%m"))
    average_house_prices_dict = average_house_prices.set_index("year_month")["price"].to_dict()
    return average_house_prices_dict

def adjusted_house_value_median_sales_price(index_date, mortgage_rate_data, average_house_prices):
    index_year = index_date.year
    index_month = index_date.month
    index_price = average_house_prices.get(f"{index_year}-{index_month:02d}", None)
    if index_price is None:
        previous_date = None
        for year_month in sorted(average_house_prices.keys()):
            year, month = map(int, year_month.split("-"))
            if datetime.date(year, month, 1) > index_date:
                break
            previous_date = year_month
        if previous_date is None:
            raise ValueError("No median sales price data found for the specified date or any prior date.")
        index_price = average_house_prices[previous_date]

    if index_price == 0:
        raise ValueError(f"No median sales price data found for {index_year}-{index_month:02d}")
    index_payment = calculate_monthly_mortgage(index_price, index_year, index_month, mortgage_rate_data)

    house_values = {}
    for year_month, rate in mortgage_rate_data.items():
        year, month = map(int, year_month.split('-'))
        date = datetime.date(year, month, 1)

        monthly_interest_rate = (rate / 100) / 12
        num_payments = 30 * 12
        house_value = index_payment * ((1 + monthly_interest_rate)**num_payments - 1) / (monthly_interest_rate * (1 + monthly_interest_rate)**num_payments)
        house_values[date] = house_value

    dates = sorted(house_values.keys())
    adjusted_values = [house_values[date] for date in dates]
    average_prices = [average_house_prices.get(date.strftime("%Y-%m"), None) for date in dates]

    # Replace missing values with the previous non-missing value
    previous_value = None
    for i in range(len(average_prices)):
        if average_prices[i] is not None:
            previous_value = average_prices[i]
        else:
            average_prices[i] = previous_value

    fig = sp.make_subplots(rows=2, cols=1, shared_xaxes=True, vertical_spacing=0.1,
                           subplot_titles=("Adjusted House Value Based on Mortgage Payment and Median Sales Price",
                                           "30-Year Fixed Rate Mortgage Average in the United States / Effective Federal Funds Rate",
                                           ),
                           specs=[[{"secondary_y": True}], [{"secondary_y": True}]])

    # Add the main plot trace to the subplots figure
    fig.add_trace(go.Scatter(x=dates, y=adjusted_values, mode="lines", name="Adjusted House Value"), row=1, col=1)
    fig.add_trace(go.Scatter(x=dates, y=average_prices, mode="lines", name="Median Sales Price"), row=1, col=1, secondary_y=True)
    fig.add_trace(go.Scatter(x=[index_date], y=[index_price], mode="markers", marker=dict(color="red", size=8),
                             name=f"Index Value (${index_price:.2f})"), row=1, col=1, secondary_y=True)

    # Add traces for mortgage rates and federal funds rates
    fig.add_trace(go.Scatter(x=dates, y=mortgage_rates, mode="lines", name="Mortgage Rates"), row=2, col=1)
    fig.add_trace(go.Scatter(x=dates, y=federal_funds_rates, mode="lines", name="Federal Funds Rates"), row=2, col=1, secondary_y=True)

    # Update the layout for the subplots figure
    fig.update_layout(title="Adjusted House Value Based on Mortgage Payment and Median Sales Price",
                      xaxis_title="Date", yaxis_title="Adjusted House Value ($)")

    fig.update_yaxes(title_text="Median Sales Price ($)", secondary_y=True, row=1, col=1)
    fig.update_yaxes(title_text="Mortgage Rates (%)", row=2, col=1)
    fig.update_yaxes(title_text="Federal Funds Rates (%)", secondary_y=True, row=2, col=1)

    pio.show(fig)
    pyo.plot(fig, filename="output.html", auto_open=False)


if __name__ == '__main__':
    start_date = datetime.date(1972, 1, 1)
    end_date = datetime.date(2023, 5, 1)
    price = 449300
    # index_date = datetime.date(2022, 4, 1)
    index_date = datetime.date(2023, 4, 1)

    # Fetch data for the two new subplots
    historical_mortgage_rates = get_historical_mortgage_rates(api_key, 'MORTGAGE30US', start_date, end_date)
    average_house_prices = get_average_house_prices(api_key, 'MSPUS', start_date, end_date)
    federal_funds_rates = get_historical_mortgage_rates(api_key, 'FEDFUNDS', start_date, end_date)

    dates = sorted(set(list(historical_mortgage_rates.keys()) + list(average_house_prices.keys()) + list(federal_funds_rates.keys())))
    dates = [datetime.datetime.strptime(date, "%Y-%m").date() for date in dates]

    mortgage_rates = [historical_mortgage_rates.get(date.strftime("%Y-%m"), None) for date in dates]
    federal_funds_rates = [federal_funds_rates.get(date.strftime("%Y-%m"), None) for date in dates]

    monthly_mortgage_payment = calculate_monthly_mortgage(price, index_date.year, index_date.month, historical_mortgage_rates)
    print(f"Monthly mortgage payment: ${monthly_mortgage_payment:.2f}")

    adjusted_house_value_median_sales_price(index_date, historical_mortgage_rates, average_house_prices)
This code does require a config.py file with a reference to your own FRED API key which can be obtained here – https://fredaccount.stlouisfed.org/apikeys
api_key = ‘xxxxxxxxxxxxxxxxxxxxxxxxxxxxxx’