
I wanted to analyze the relationship between the Federal Reserve’s (Fed) raising or lowering of interest rates and its impact on the S&P 500 and the median house price. I wrote Python code that fetches data from the St. Louis Fed’s FRED API, processes it, and performs various calculations and visualizations.
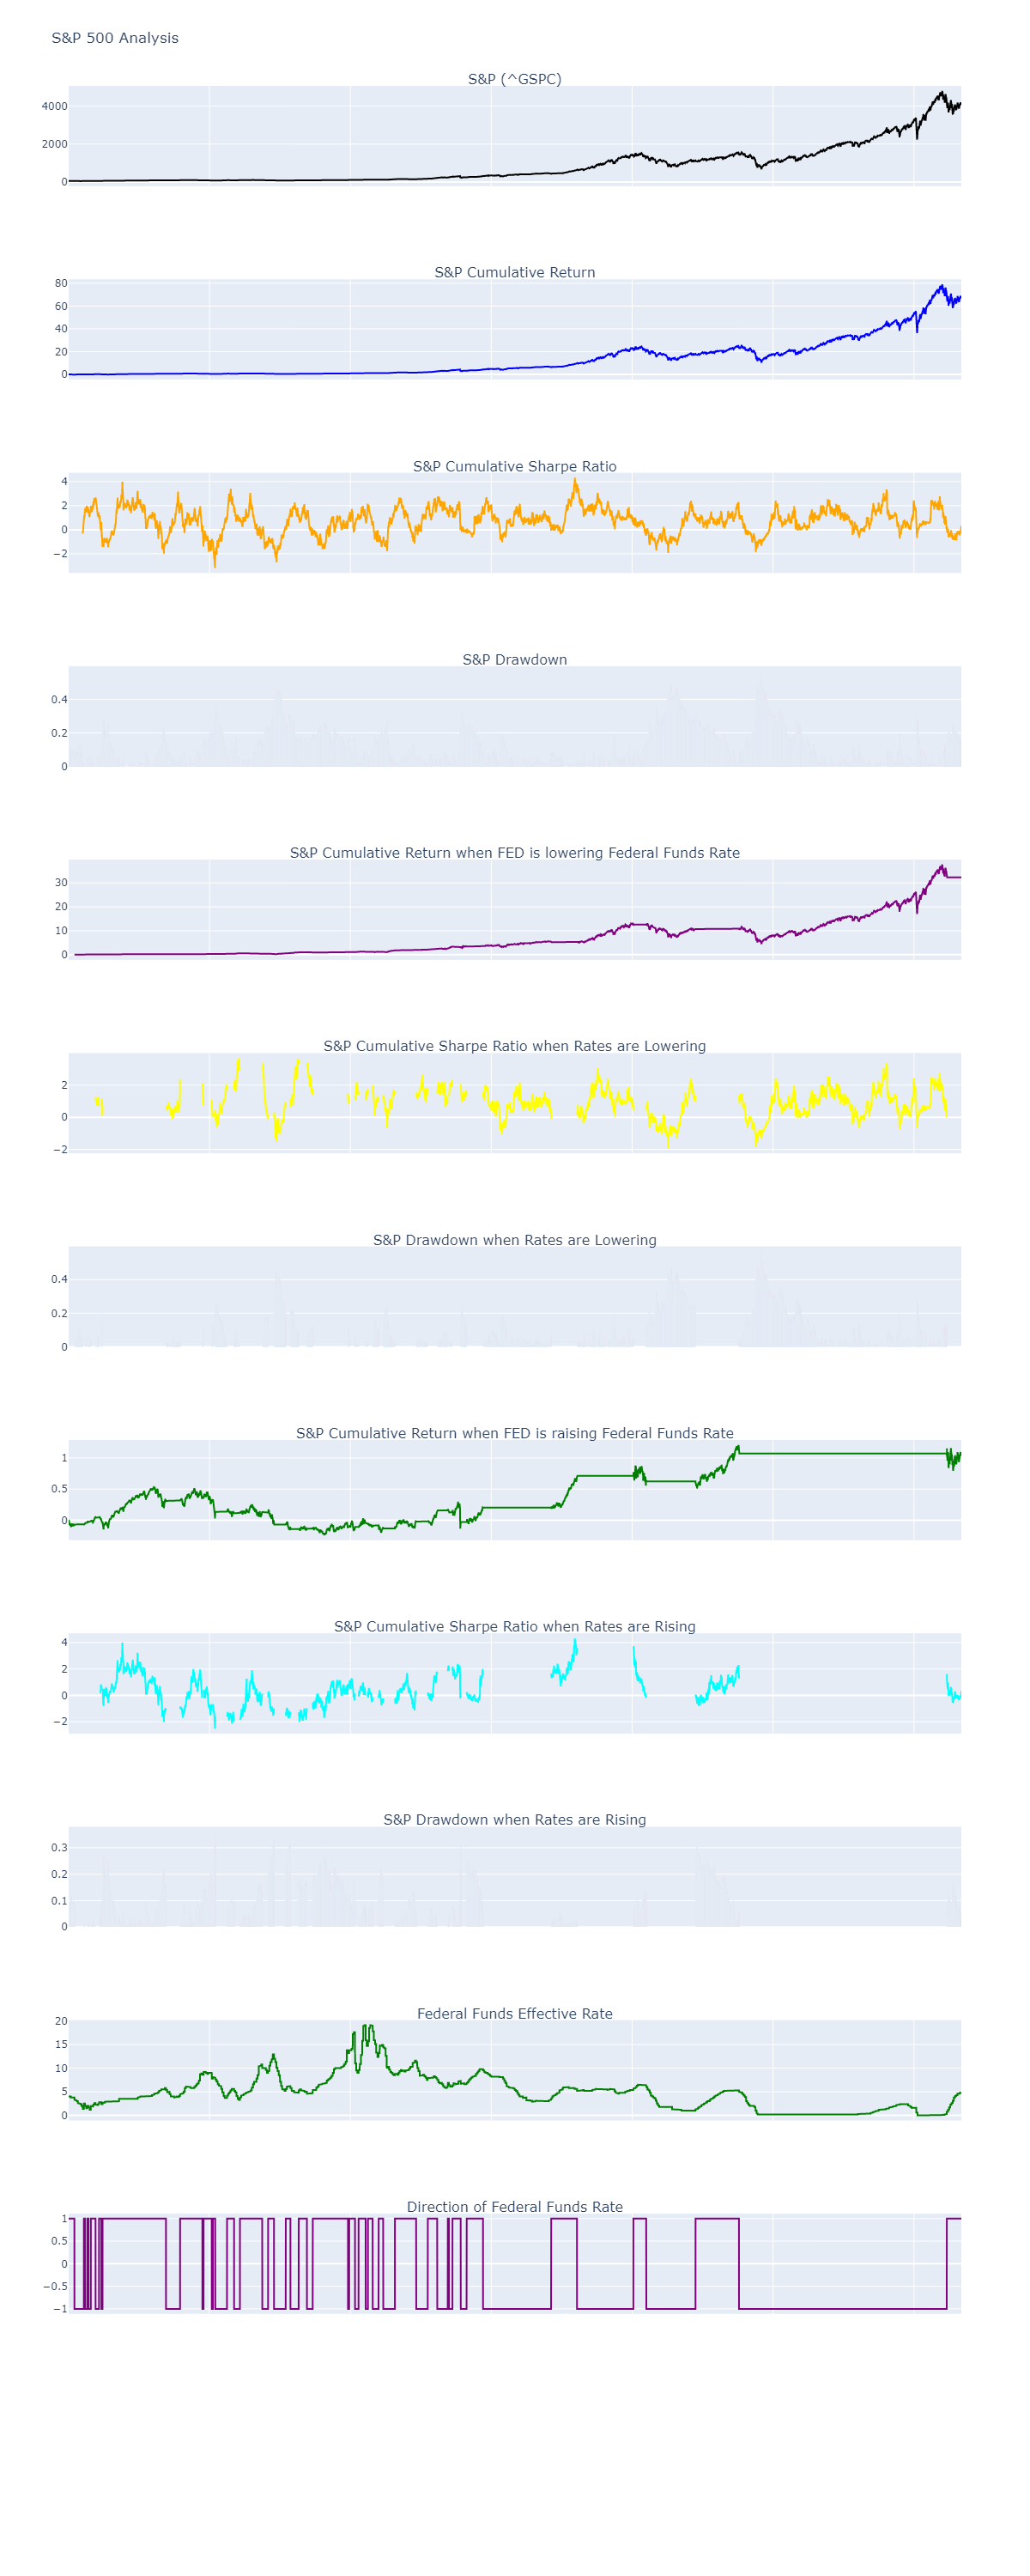
Here is the S&P 500 output:
Here is the median house price output:

To begin, I imported the necessary libraries such as requests, pandas, numpy, yfinance, and plotly. These libraries provide functions and tools for data retrieval, manipulation, analysis, and visualization.
The first part of the code focuses on fetching and processing the data related to the Federal Funds Rate (federal_funds_rate_id) and the S&P 500 Index (sp500_id). The get_data function retrieves the Federal Funds Rate data from the FRED API and returns a DataFrame. It processes the data by rounding the rate to the tenth of a percent, creating a new index that extends up to the current date, and filling any missing values with the previous value.
Similarly, the get_sp500_data function uses the Yahoo Finance library (yfinance) to download the historical data of the S&P 500 Total Return Index. It returns a DataFrame containing the adjusted closing prices of the index.
Next, the compute_direction function calculates the direction of the Federal Funds Rate based on the changes in its values. It adds a ‘direction’ column to the DataFrame, where 1 represents an increasing rate, -1 represents a decreasing rate, and 0 represents no change. The function also computes the cumulative difference in rates.
The compute_returns function calculates the daily returns and cumulative returns of the S&P 500 based on the adjusted closing prices. It adds ‘daily_return’, ‘cumulative_return’, ‘cumulative_return_up’, and ‘cumulative_return_down’ columns to the DataFrame. The ‘cumulative_return_up’ and ‘cumulative_return_down’ columns represent the cumulative returns when the Federal Funds Rate is increasing and decreasing, respectively. The function fills any missing values in these columns with the previous value to ensure continuity.
The compute_sharpe_ratio function computes the rolling Sharpe ratios of the S&P 500. It calculates the rolling mean and standard deviation of the daily returns and adds ‘sharpe_ratio_cumulative’, ‘sharpe_ratio_up’, and ‘sharpe_ratio_down’ columns to the DataFrame. The ‘sharpe_ratio_cumulative’ column represents the overall Sharpe ratio, while ‘sharpe_ratio_up’ and ‘sharpe_ratio_down’ represent the Sharpe ratios when the Federal Funds Rate is increasing and decreasing, respectively.
The visualize function generates linked charts using Plotly. It creates a subplot with multiple rows and columns and adds different traces for each chart. The charts include the S&P 500 Index, cumulative returns, cumulative Sharpe ratios, drawdowns, and their respective variations based on the direction of the Federal Funds Rate. The function adjusts the layout properties and displays the charts.
The compute_drawdown function calculates the drawdowns of the S&P 500 based on the maximum value reached by the index. It adds ‘drawdown’, ‘drawdown_up’, and ‘drawdown_down’ columns to the DataFrame. The ‘drawdown’ column represents the overall drawdown, while ‘drawdown_up’ and ‘drawdown_down’ represent the drawdowns when the Federal Funds Rate is increasing and decreasing, respectively.
In the main part of the code, I define the analysis period, fetch the data for the Federal Funds Rate and the S&P 500, and combine them into a single DataFrame. I then compute returns, drawdowns, and Sharpe ratios for the combined data. The DataFrame is saved to a CSV file for further analysis.
Finally, the visualize function is called to generate and display the linked charts for the S&P 500 analysis.
To analyze the relationship between the Federal Funds Rate and the median house price, I modified the code accordingly. I replaced the S&P 500-related functions and variables with their counterparts for the median house price. The get_house_price_data function fetches the data for the median house price, and the visualize function generates the charts specifically for the median house price analysis. The remaining parts of the code remain the same.
In conclusion, this code provides a comprehensive analysis of the relationship between the Federal Funds Rate, the S&P 500, and the median house price. It fetches the necessary data, performs calculations, and generates visualizations to gain insights into the impact of interest rate changes on these economic indicators. The code can be customized and extended for further analysis or applied to other datasets of interest.