
Housing affordability is a critical issue that affects millions of individuals and families. Understanding trends in housing affordability can provide insights into financial stability, economic conditions, and policy impacts. This article presents a Python script that utilizes public data from the Federal Reserve Economic Data (FRED) API to analyze housing affordability trends. The script retrieves and processes data, calculates key metrics, and presents the results in a clear and interpretable format.
The Python Code
My Python script leverages several libraries – including requests, pandas, and plotly – to fetch, process, and visualize the data. We fetch three key datasets from the FRED API: the median sales price of houses sold in the U.S., real disposable personal income, and the average mortgage interest rate. These three variables are the core components of our housing affordability analysis.
Here’s an overview of how the script works:
- Data Retrieval: The
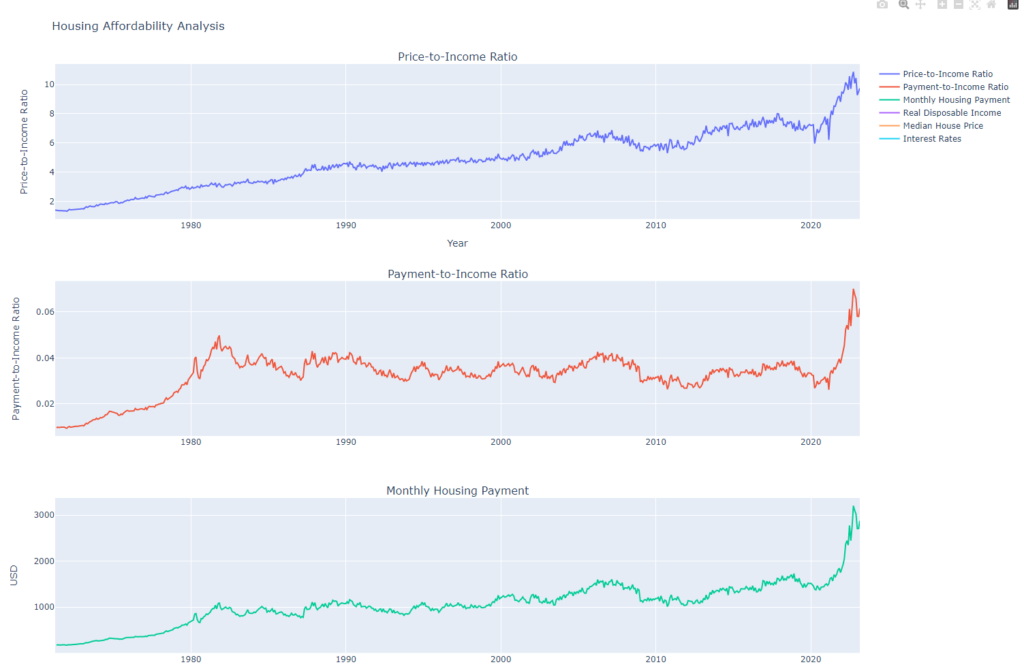
get_datafunction fetches data from the FRED API. It takes a series ID as input and returns a pandas DataFrame containing the data series. - Metric Calculation: We calculate two key ratios to assess housing affordability. The first is the ‘Price-to-Income Ratio’, which is the median house price divided by the real disposable personal income. This ratio measures the relative cost of housing to available income. The second ratio is the ‘Payment-to-Income Ratio’, computed as the monthly mortgage payment divided by the real disposable personal income. This ratio measures the burden of mortgage payments on the available income.
- Data Visualization: We use plotly to create an interactive line chart showing these two ratios over time. We also plot the raw values of median house price and real disposable personal income for reference.
Understanding housing affordability is essential for a broad range of applications, from personal finance to macroeconomic policy. With Python and public data APIs, we can create powerful tools to analyze and understand these complex trends.