
In the realm of intraday trading, managing and minimizing trading costs is not just a practice; it’s a necessity. A strategy that seems profitable on paper can quickly become a losing proposition when real-world costs, particularly the spread between the bid and ask prices, are factored in. Today, I’d like to share a comprehensive analysis tool I developed to focus on this.
Output
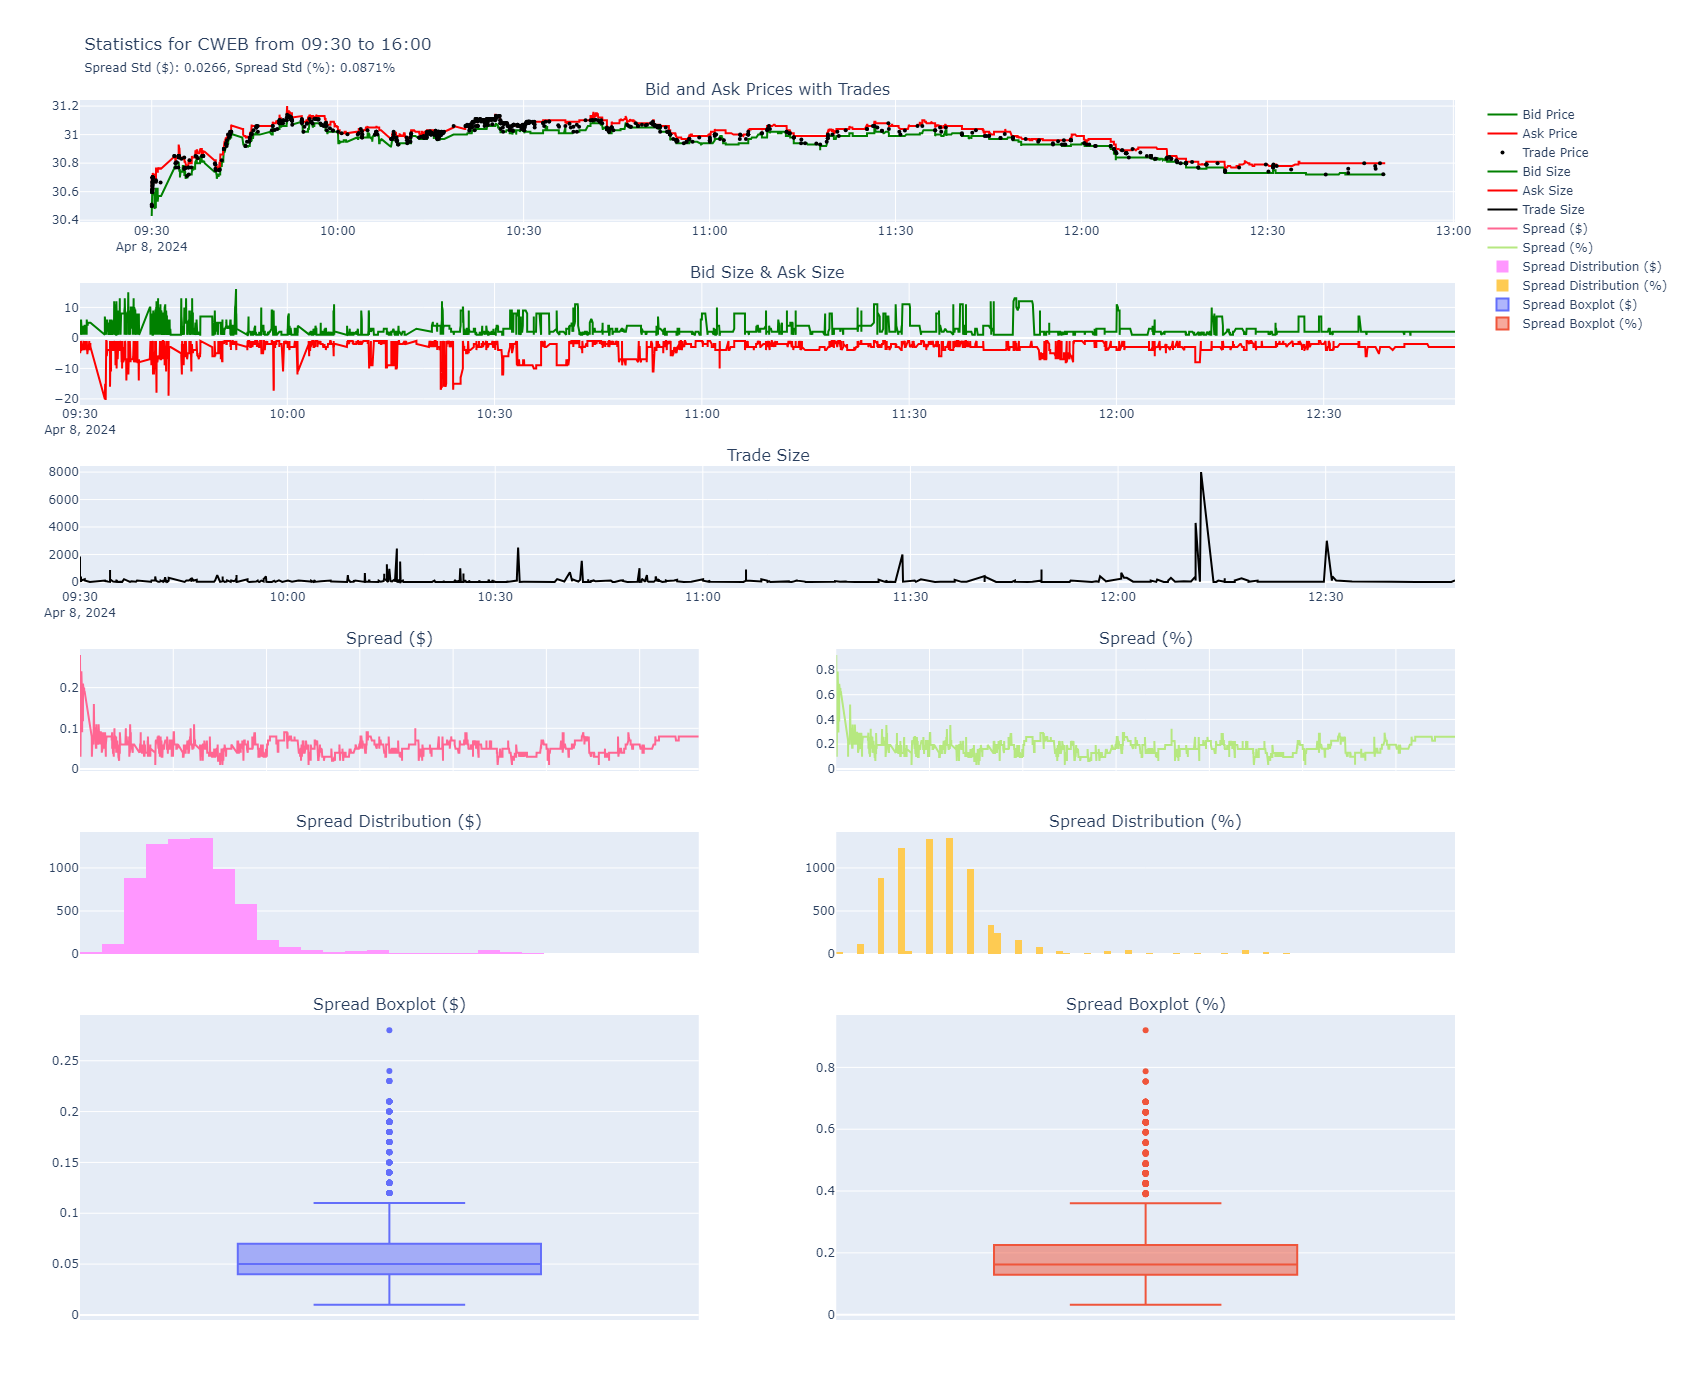
This is the HTML output plot generated by the program. Below you’ll see some data followed by some important metrics. Note that the title has the spread standard deviation in dollars and percent. As well the actual values are shown in the plots below with their distribution and boxplots.
The Importance of Spread Analysis
Bid Price
The “bid” is the highest price a buyer is willing to pay for a stock. It essentially represents the demand side of the market for a particular stock. When you’re selling a stock, the bid price is the most you can hope to get at that moment. It’s a real-time reflection of what buyers believe the stock is worth, based on their analysis, market conditions, and other factors. The bid price is constantly changing as buyers adjust their willingness to pay in response to market dynamics.
Ask Price
Conversely, the “ask” price is the lowest price at which a seller is willing to sell their stock. It represents the supply side of the equation. When you’re looking to buy a stock, the ask price is the lowest you can expect to pay at that moment. Like the bid price, the ask is always in flux, influenced by sellers’ perceptions of the stock’s value, market trends, and various economic indicators.
The Bid-Ask Spread
The difference between the bid and ask price is known as the “spread.” The spread can be a critical indicator of a stock’s liquidity and market volatility. A narrow spread typically indicates a highly liquid market with a high volume of transactions and minimal difference between what buyers are willing to pay and what sellers are asking. Conversely, a wider spread suggests lower liquidity, potentially making it more challenging to execute large trades without affecting the market price.
Now that we’ve explored the bid-ask spread let’s establish why spread analysis is crucial. The spread directly impacts your trading costs. For high-frequency traders, even small variances in this spread can significantly affect overall profitability. My tool is designed to subscribe to Alpaca’s API, fetching real-time quotes and prices alongside their volume. This setup allows us to compute the spread both as a dollar value and as a percentage of the asset’s value, offering a clear view of the trading costs involved.
The Tool’s Anatomy
The tool comprises two Python files: alpaca_plots.py and alpaca_functions.py. The former is primarily responsible for the data visualization aspect, while the latter deals with data fetching, processing, and statistics calculation.
Key Functions and Their Roles
- Data Subscription and Handling: At the core, my tool subscribes to quote and trade updates via Alpaca’s API, focusing on a list of specified symbols. This is crucial for accessing real-time data, essential for accurate spread analysis.
- Spread Calculation: Once data is fetched, the tool calculates the spread in both dollar value and percentage. This is done by subtracting the bid price from the ask price for each quote, providing an immediate measure of the trading cost for that specific asset.
- Statistical Analysis: Beyond mere calculation, the tool also analyzes the distribution of spread values, including their standard deviation. This statistical approach allows traders to understand not just the average costs, but also the variability and risk associated with the spread.
- Data Visualization: A key feature is its ability to generate insightful visualizations, including boxplots. These plots offer a visual representation of the spread distribution, highlighting the median, quartiles, and any outliers. This visual context is invaluable for traders looking to assess the cost implications of their strategies quickly.
Practical Application and Insights
By analyzing the spread in both absolute and relative terms, traders can make informed decisions about which assets to trade and when. For example, a high spread as a percentage of the asset’s value might deter trading in certain assets during specific times, guiding traders towards more cost-effective opportunities.
In Summary
This tool is more than just a technical exercise; it’s a practical solution to a problem many traders face daily. By offering a detailed analysis of Alpaca spreads, it empowers traders to make data-driven decisions, ultimately enhancing the profitability of their trading strategies. Whether you’re a seasoned trader or just starting, understanding and applying such tools can significantly impact your trading success.
Code
alpaca_functions.py
import alpaca_trade_api as tradeapi
import pandas as pd
import os
import plotly.graph_objects as go
from plotly.subplots import make_subplots
from alpaca_config import api_key, api_secret, base_url
import logging
import asyncio
from pathlib import Path
from datetime import datetime
import subprocess

logging.basicConfig(level=logging.INFO, format='%(asctime)s - %(levelname)s - %(message)s')

# Global DataFrame for accumulating quote data
quotes_data = pd.DataFrame(columns=['symbol', 'bid_price', 'ask_price', 'bid_size', 'ask_size'])
trades_data = pd.DataFrame(columns=['symbol', 'trade_price', 'trade_size'])

def kill_other_instances(exclude_pid):
    try:
        # Get the list of processes matching the script name
        result = subprocess.run(['pgrep', '-f', 'alpaca_functions.py'], stdout=subprocess.PIPE)
        if result.stdout:
            pids = result.stdout.decode('utf-8').strip().split('\n')
            for pid in pids:
                if pid != exclude_pid:
                    try:
                        # Terminate the process
                        subprocess.run(['kill', pid])
                        logging.warning(f"Terminated process with PID: {pid}")
                    except subprocess.CalledProcessError as e:
                        logging.error(f"Could not terminate process with PID: {pid}. Error: {e}")
        else:
            logging.info("No other instances found.")
    except subprocess.CalledProcessError as e:
        logging.info(f"Error finding processes: {e}")
async def get_market_hours(api, date_str):
    # Convert date_str to date object
    specific_date = datetime.strptime(date_str, '%Y-%m-%d').date()
    # Format the date as a string in 'YYYY-MM-DD' format
    date_str = specific_date.strftime('%Y-%m-%d')

    # Fetch the market calendar for the specific date
    calendar = api.get_calendar(start=date_str, end=date_str)

    logging.debug(f'{calendar}')

    if calendar:
        market_open = calendar[0].open.strftime('%H:%M')
        market_close = calendar[0].close.strftime('%H:%M')
        logging.info(f"Market hours for {date_str}: {market_open} - {market_close}")
        return market_open, market_close
    else:
        logging.warning(f"No market hours found for {date_str}.")
        return None, None

async def consolidate_parquet_files(quotes_directory, trades_directory):
    async def process_directory(directory):
        for day_dir in Path(directory).iterdir():
            if day_dir.is_dir():
                symbol_dfs = {}

                parquet_files = list(day_dir.glob("*.parquet"))
                if not parquet_files:
                    logging.info(f"No Parquet files found in {day_dir}.")
                    continue

                for file in parquet_files:
                    if '_' in file.stem:
                        symbol = file.stem.split('_')[0]
                        df = pd.read_parquet(file)

                        if symbol in symbol_dfs:
                            symbol_dfs[symbol] = pd.concat([symbol_dfs[symbol], df])
                        else:
                            symbol_dfs[symbol] = df

                for symbol, df in symbol_dfs.items():
                    consolidated_filename = f"{symbol}.parquet"
                    consolidated_file_path = day_dir / consolidated_filename

                    if consolidated_file_path.is_file():
                        consolidated_df = pd.read_parquet(consolidated_file_path)
                        consolidated_df = pd.concat([consolidated_df, df])
                        consolidated_df = consolidated_df[~consolidated_df.index.duplicated(keep='last')]
                        consolidated_df = consolidated_df.sort_index()  # Modified to eliminate the warning
                        consolidated_df.to_parquet(consolidated_file_path, index=True)
                        logging.debug(f"Updated consolidated file: {consolidated_filename}")
                    else:
                        df = df[~df.index.duplicated(keep='last')]
                        df = df.sort_index()  # Modified to eliminate the warning
                        df.to_parquet(consolidated_file_path, index=True)
                        logging.info(f"Consolidated {consolidated_filename}")

                for file in parquet_files:
                    if '_' in file.stem:
                        try:
                            os.remove(file)
                            logging.debug(f"Deleted {file}")
                        except OSError as e:
                            logging.error(f"Error deleting {file}: {e}")
            else:
                logging.info(f"Date directory {day_dir} not found or is not a directory.")

    await asyncio.gather(
        process_directory(quotes_directory),
        process_directory(trades_directory)
    )
# Function to check symbol properties
async def check_symbol_properties(api, symbols):
    not_active, not_tradeable, not_shortable = [], [], []
    for symbol in symbols:
        asset = api.get_asset(symbol)  # Removed 'await' as get_asset is not an async function
        if asset.status != 'active':
            not_active.append(symbol)
        if not asset.tradable:
            not_tradeable.append(symbol)
        if not asset.shortable:
            not_shortable.append(symbol)
    return not_active, not_tradeable, not_shortable

def process_quote(quote):
    logging.debug(quote)

    timestamp = pd.to_datetime(quote.timestamp, unit='ns').tz_convert('America/New_York')

    quote_df = pd.DataFrame({
        'symbol': [quote.symbol],
        'bid_price': [quote.bid_price],
        'ask_price': [quote.ask_price],
        'bid_size': [quote.bid_size],
        'ask_size': [quote.ask_size],
        'timestamp': [timestamp]
    }).set_index('timestamp')

    return quote_df

def process_trade(trade):
    logging.debug(trade)

    timestamp = pd.to_datetime(trade.timestamp, unit='ns').tz_convert('America/New_York')

    trade_df = pd.DataFrame({
        'symbol': [trade.symbol],
        'trade_price': [trade.price],
        'trade_size': [trade.size],
        'timestamp': [timestamp]
    }).set_index('timestamp')

    return trade_df

async def periodic_save(interval_seconds=3600, quotes_directory='/home/shared/algos/ml4t/data/alpaca_quotes/', trades_directory='/home/shared/algos/ml4t/data/alpaca_trades/'):
    global quotes_data, trades_data
    while True:
        try:
            logging.info('Running periodic save...')
            current_time = datetime.now()
            date_str = current_time.strftime('%Y-%m-%d')
            hour_str = current_time.strftime('%H-%M-%S')

            # Saving quotes data
            if not quotes_data.empty:
                quotes_day_directory = os.path.join(quotes_directory, date_str)
                os.makedirs(quotes_day_directory, exist_ok=True)
                for symbol, group in quotes_data.groupby('symbol'):
                    filepath = os.path.join(quotes_day_directory, f"{symbol}_{date_str}_{hour_str}.parquet")
                    group.to_parquet(filepath, index=True)
                logging.info(f"Saved all quotes for {date_str} {hour_str} to disk.")
                quotes_data.drop(quotes_data.index, inplace=True)  # Clearing the DataFrame
            else:
                logging.warning('quotes_data is empty')
            # Saving trades data
            if not trades_data.empty:
                trades_day_directory = os.path.join(trades_directory, date_str)
                os.makedirs(trades_day_directory, exist_ok=True)
                for symbol, group in trades_data.groupby('symbol'):
                    filepath = os.path.join(trades_day_directory, f"{symbol}_{date_str}_{hour_str}.parquet")
                    group.to_parquet(filepath, index=True)
                logging.info(f"Saved all trades for {date_str} {hour_str} to disk.")
                trades_data.drop(trades_data.index, inplace=True)  # Clearing the DataFrame
            else:
                logging.warning('trades_data is empty')

            await asyncio.sleep(interval_seconds)

        except Exception as e:
                logging.error(f'Error in periodic_save: {e}')  # Properly logging the exception message


async def run_alpaca_monitor(symbols, remove_not_shortable=False):
    # Initialize the Alpaca API
    api = tradeapi.REST(api_key, api_secret, base_url, api_version='v2')

    total_symbols = len(symbols)

    not_active, not_tradeable, not_shortable = await check_symbol_properties(api, symbols)
    # Calculate and log percentages...
    if remove_not_shortable:
        symbols = [symbol for symbol in symbols if symbol not in not_active + not_tradeable + not_shortable]
    else:
        symbols = [symbol for symbol in symbols if symbol not in not_active + not_tradeable]

    logging.info(f'Monitoring the following symbols: {symbols}')

    # Calculate and log percentages
    percent_not_active = (len(not_active) / total_symbols) * 100
    percent_not_tradeable = (len(not_tradeable) / total_symbols) * 100
    percent_not_shortable = (len(not_shortable) / total_symbols) * 100

    logging.info(f"Percentage of symbols not active: {percent_not_active:.2f}%")
    logging.info(f"Percentage of symbols not tradeable: {percent_not_tradeable:.2f}%")
    logging.info(f"Percentage of symbols not shortable: {percent_not_shortable:.2f}%")

    # Remove symbols that are not active, tradeable, or shortable
    symbols = [symbol for symbol in symbols if symbol not in not_active + not_tradeable + not_shortable]

    logging.info(f'Monitoring the following symbols: {symbols}')

    stream = tradeapi.stream.Stream(api_key, api_secret, base_url, data_feed='sip')

    async def handle_quote(q):
        global quotes_data
        new_quote = process_quote(q)
        quotes_data = pd.concat([quotes_data, new_quote], ignore_index=False)
        logging.debug(f'quotes \n {quotes_data.tail()}')

    async def handle_trade(t):
        global trades_data
        new_trade = process_trade(t)
        trades_data = pd.concat([trades_data, new_trade], ignore_index=False)
        logging.debug(f'trades \n {trades_data.tail()}')

    async def consolidate_periodically(interval, quotes_directory, trades_directory):
        while True:
            try:
                await consolidate_parquet_files(quotes_directory, trades_directory)
            except Exception as e:
                logging.error(f"Error consolidating parquet files: {e}")
                # Handle the error as needed, for example, break the loop, or continue
            await asyncio.sleep(interval)

    save_quotes_task = asyncio.create_task(periodic_save(180, '/home/shared/algos/ml4t/data/alpaca_quotes/', '/home/shared/algos/ml4t/data/alpaca_trades/'))
    consolidate_task = asyncio.create_task(consolidate_periodically(180, '/home/shared/algos/ml4t/data/alpaca_quotes', '/home/shared/algos/ml4t/data/alpaca_trades'))


    try:
        # Subscribe to the streams
        for symbol in symbols:
            stream.subscribe_quotes(handle_quote, symbol)
            stream.subscribe_trades(handle_trade, symbol)

        await stream._run_forever()

    except ValueError as e:
        if "auth failed" in str(e) or "connection limit exceeded" in str(e):
            # Log the specific error message without re-raising the exception to avoid showing traceback
            logging.error(f"WebSocket authentication error: {e}")
        else:
            # For other ValueErrors, log them and optionally re-raise if you want to show the traceback
            logging.error(f"Error with WebSocket connection: {e}")


if __name__ == "__main__":
    current_pid = str(os.getpid())
    kill_other_instances(current_pid)

    csv_file = '/home/shared/algos/ml4t/data/selected_pairs_with_values.csv'
    df = pd.read_csv(csv_file)
    symbols = list(set(df['s1'].tolist() + df['s2'].tolist()))
    symbols = [symbol.replace('-', '.') for symbol in symbols]

    quotes_dir='/home/shared/algos/ml4t/data/alpaca_quotes'
    trades_dir='/home/shared/algos/ml4t/data/alpaca_trades'
    asyncio.run(run_alpaca_monitor(symbols))
alpaca_plots.py
import asyncio
import logging
from datetime import datetime
import pandas as pd
from pathlib import Path
import plotly.graph_objects as go
from plotly.subplots import make_subplots
import alpaca_trade_api as tradeapi
from alpaca_config import api_key, api_secret, base_url

logging.basicConfig(level=logging.INFO, format='%(asctime)s - %(levelname)s - %(message)s')

def get_market_hours(api, date_str):
    # Convert date_str to date object
    specific_date = datetime.strptime(date_str, '%Y-%m-%d').date()
    # Format the date as a string in 'YYYY-MM-DD' format
    date_str = specific_date.strftime('%Y-%m-%d')

    # Fetch the market calendar for the specific date
    calendar = api.get_calendar(start=date_str, end=date_str)

    logging.debug(f'{calendar}')

    if calendar:
        market_open = calendar[0].open.strftime('%H:%M')
        market_close = calendar[0].close.strftime('%H:%M')
        logging.info(f"Market hours for {date_str}: {market_open} - {market_close}")
        return market_open, market_close
    else:
        logging.warning(f"No market hours found for {date_str}.")
        return None, None


def load_and_plot_data(quotes_directory, trades_directory, symbols, api):
    logging.info(f'Running load_and_plot_data')
    today = datetime.now().strftime('%Y-%m-%d')
    #override today for testing
    # today = '2024-04-05'

    try:
        # Use today to get market hours
        market_open, market_close = get_market_hours(api, today)
        # Check if date directories exist
        quotes_date_dir = Path(quotes_directory) / today
        trades_date_dir = Path(trades_directory) / today

        if not quotes_date_dir.exists():
            logging.error(f"Quotes directory for date {today} not found: {quotes_date_dir}")
            return
        if not trades_date_dir.exists():
            logging.error(f"Trades directory for date {today} not found: {trades_date_dir}")
            return

        for symbol in symbols:
            # Construct file paths
            quotes_file_path = quotes_date_dir / f"{symbol}.parquet"
            trades_file_path = trades_date_dir / f"{symbol}.parquet"

            # Load the data
            if quotes_file_path.exists() and trades_file_path.exists():
                symbol_quotes = pd.read_parquet(quotes_file_path)
                symbol_trades = pd.read_parquet(trades_file_path)

                logging.debug(f"Loaded {symbol_quotes.shape[0]} quotes and {symbol_trades.shape[0]} trades for {symbol} on {today}.")
                # Filter symbol_quotes and symbol_trades to market hours
                market_open_time = datetime.strptime(market_open, '%H:%M').time()
                market_close_time = datetime.strptime(market_close, '%H:%M').time()
                symbol_quotes = symbol_quotes.between_time(market_open_time, market_close_time)
                symbol_trades = symbol_trades.between_time(market_open_time, market_close_time)
                # Call plot_statistics with filtered data
                plot_statistics(symbol_quotes, symbol_trades, symbol, market_open, market_close)
            else:
                missing_files = []
                if not quotes_file_path.exists():
                    missing_files.append(f"quotes file for {symbol} and path {quotes_file_path}")
                if not trades_file_path.exists():
                    missing_files.append(f"trades file for {symbol} and path {trades_file_path}")
                logging.warning(f"Missing {', and '.join(missing_files)} on {today}.")
        logging.info(f'Finished loading and plotting data')
    except Exception as e:
        logging.error(f"Error loading and plotting data for {today}: {e}")
        return

def plot_statistics(symbol_quotes, symbol_trades, symbol, market_open, market_close):
    logging.info(f'Running plot_statistics for {symbol}')

    if not symbol_quotes.empty and not symbol_trades.empty:
        # Calculate 'spread' and 'spread_percentage' directly on symbol_quotes
        symbol_quotes['spread'] = symbol_quotes['ask_price'] - symbol_quotes['bid_price']
        symbol_quotes['spread_percentage'] = (symbol_quotes['spread'] / symbol_quotes['bid_price']) * 100

        # Calculate standard deviation of spread and spread_percentage
        spread_std = symbol_quotes['spread'].std()
        spread_percentage_std = symbol_quotes['spread_percentage'].std()

        # Make ask_size negative
        symbol_quotes['negative_ask_size'] = -symbol_quotes['ask_size']

        logging.info(f"Spread Standard Deviation for {symbol}: ${spread_std:.4f} ({spread_percentage_std:.4f}%)")

        # Prepare the figure with subplots
        fig = make_subplots(rows=7, cols=2,
                            subplot_titles=("Bid and Ask Prices with Trades", "Bid Size & Ask Size", "Trade Size",
                                            "Spread ($)", "Spread (%)",
                                            "Spread Distribution ($)", "Spread Distribution (%)",
                                            "Spread Boxplot ($)", "Spread Boxplot (%)"),
                            specs=[[{"colspan": 2}, None], [{"colspan": 2}, None], [{"colspan": 2}, None],
                                   [{}, {}], [{}, {}], [{"rowspan": 2}, {"rowspan": 2}], [{}, {}]],
                            shared_xaxes=True, vertical_spacing=0.05)

        # Bid and Ask Prices with Trades
        fig.add_trace(go.Scatter(x=symbol_quotes.index, y=symbol_quotes['bid_price'], mode='lines',
                                 name='Bid Price', line=dict(color='green')),
                      row=1, col=1)
        fig.add_trace(go.Scatter(x=symbol_quotes.index, y=symbol_quotes['ask_price'], mode='lines',
                                 name='Ask Price', line=dict(color='red')),
                      row=1, col=1)
        fig.add_trace(go.Scatter(x=symbol_trades.index, y=symbol_trades['trade_price'], mode='markers',
                                 name='Trade Price', marker=dict(color='black', size=4)),
                      row=1, col=1)

        # # Bid Size & Ask Size as line charts with colors
        # fig.add_trace(go.Scatter(x=symbol_quotes.index, y=symbol_quotes['bid_size'], mode='lines',
        #                          name='Bid Size', line=dict(color='red')),
        #               row=2, col=1)
        # fig.add_trace(go.Scatter(x=symbol_quotes.index, y=symbol_quotes['ask_size'], mode='lines',
        #                          name='Ask Size', line=dict(color='green')),
        #               row=2, col=1)


        # Bid Size & Ask Size as line charts with colors, making ask_size negative
        fig.add_trace(go.Scatter(x=symbol_quotes.index, y=symbol_quotes['bid_size'], mode='lines',
                                 name='Bid Size', line=dict(color='green')),
                      row=2, col=1)
        fig.add_trace(go.Scatter(x=symbol_quotes.index, y=symbol_quotes['negative_ask_size'], mode='lines',
                                 name='Ask Size', line=dict(color='red')),
                      row=2, col=1)


        # Trade Size as a line chart with color
        fig.add_trace(go.Scatter(x=symbol_trades.index, y=symbol_trades['trade_size'], mode='lines',
                                 name='Trade Size', line=dict(color='black')),
                      row=3, col=1)

        # Spread ($)
        fig.add_trace(go.Scatter(x=symbol_quotes.index, y=symbol_quotes['spread'], mode='lines', name='Spread ($)'), row=4, col=1)
        # Spread (%)
        fig.add_trace(go.Scatter(x=symbol_quotes.index, y=symbol_quotes['spread_percentage'], mode='lines', name='Spread (%)'), row=4, col=2)

        # Spread Distribution ($)
        fig.add_trace(go.Histogram(x=symbol_quotes['spread'], name='Spread Distribution ($)'), row=5, col=1)
        # Spread Distribution (%)
        fig.add_trace(go.Histogram(x=symbol_quotes['spread_percentage'], name='Spread Distribution (%)'), row=5, col=2)

        # Spread Boxplot ($)
        fig.add_trace(go.Box(y=symbol_quotes['spread'], name='Spread Boxplot ($)'), row=6, col=1)
        # Spread Boxplot (%)
        fig.add_trace(go.Box(y=symbol_quotes['spread_percentage'], name='Spread Boxplot (%)'), row=6, col=2)


        title = (
            f"Statistics for {symbol} from {market_open} to {market_close}<br>"
            f"<span style='font-size: 12px;'>Spread Std ($): {spread_std:.4f}, "
            f"Spread Std (%): {spread_percentage_std:.4f}%</span>"
        )

        # Adjust layout if needed, e.g., to update margins, titles, or axis labels
        fig.update_layout(height=1400, title_text=f"Statistics for {symbol} on {market_open} to {market_close}")
        fig.update_layout(height=1400, title_text=title)


        # Directory check and save plot
        plots_directory = Path("./plots/alpaca_quotes/")
        plots_directory.mkdir(parents=True, exist_ok=True)
        plot_filename = plots_directory / f"{symbol}_quote_trade_statistics.html"
        fig.write_html(str(plot_filename))
        logging.info(f"Plot for {symbol} saved to {plot_filename}")
    else:
        logging.warning(f'Cannot plot data for {symbol} as dataframes are empty')


def main():
    api = tradeapi.REST(api_key, api_secret, base_url, api_version='v2')


    csv_file = '/home/shared/algos/ml4t/data/selected_pairs_with_values.csv'
    df = pd.read_csv(csv_file)
    symbols = list(set(df['s1'].tolist() + df['s2'].tolist()))
    symbols = [symbol.replace('-', '.') for symbol in symbols]

    quotes_dir = '/home/shared/algos/ml4t/data/alpaca_quotes'
    trades_dir = '/home/shared/algos/ml4t/data/alpaca_trades'

    load_and_plot_data(quotes_dir, trades_dir, symbols, api)

if __name__ == "__main__":
    main()