
I’ve spent the last couple of weeks shifting my focus toward finding arbitrage opportunities in the betting markets. Today, I came across an intriguing bet on Polymarket: “Will Apple remain the largest company through September 30th?”. The question got me thinking—is Nvidia (NVDA) really about to overtake Apple (AAPL)? I knew Nvidia’s market cap had surged recently, but an 84% chance that Apple would still be the largest by the end of the month? I had to investigate further.
So, I wrote some code to analyze the odds. I used two methods:
- Probability Based on Distribution
- Probability Based on Exceedance Rate of Returns Over an X-Month Timeframe
The Basics of Polymarket Betting
Polymarket allows users to place bets on the likelihood of various events, ranging from election outcomes to company performance. These bets are binary—either “Yes” or “No.” The value of these bets fluctuates based on market sentiment, much like options in the stock market. The key to making informed decisions on such platforms lies in understanding the underlying data and probabilities. If you’re right, you get $1 per share, and if you’re wrong, you lose your stake.
Betting on Apple: An Investment Analysis
The current market sentiment suggests an 83% chance that Apple will retain its position as the largest company by September 30th. This probability is derived from the cost of betting “Yes” on Polymarket, which is currently priced at 84 cents on the dollar. If you’re right, you stand to make 16 cents per dollar invested.
But is the market sentiment accurate? Let’s delve into the historical data, statistical distributions, and probability models to assess whether this bet offers good value. This process involves analyzing how often other major companies like Microsoft (MSFT) or Nvidia (NVDA) have exceeded Apple’s growth rate in the past and whether such exceedances are likely within the given timeframe.
Frequency-Based Analysis vs. Distribution-Based Analysis
We examined two approaches:
- Frequency-Based Analysis: This method examines historical data to determine how often, on average, another company has surpassed Apple in growth rate during any given month. By calculating the “exceedance rate,” we can estimate how likely it is that Apple will be dethroned within the specified period. If this probability is high, betting “Yes” on Apple may not be favorable.
- Distribution-Based Analysis: This approach dives deeper into the statistical distribution of monthly returns, considering variance and volatility. If the data shows that other companies have frequently come close to Apple’s growth rates, the odds of an upset increase.
Determining Probability
The first step in determining the probability is to get the market cap of the top 10 companies.
import yfinance as yf
import pandas as pd

# List of top 10 companies by ticker
tickers = ["AAPL", "MSFT", "NVDA", "GOOG", "AMZN", "2222.SR", "META", "BRK-B", "TSM", "LLY"]

# Manual conversion rates (as of recent rates)
conversion_rates = {
    'SAR': 0.27,  # 1 SAR ≈ 0.27 USD
    'TWD': 0.032  # 1 TWD ≈ 0.032 USD
}

# Fetch the current market cap for each company
market_caps = {}
for ticker in tickers:
    stock = yf.Ticker(ticker)
    info = stock.info
    if 'marketCap' in info:
        market_cap = info['marketCap']
        currency = info.get('financialCurrency', 'USD')
        # Convert market cap to USD if it's not already in USD
        if currency != 'USD':
            if currency in conversion_rates:
                market_cap = market_cap * conversion_rates[currency]
            else:
                print(f"Conversion rate for {currency} not found, skipping conversion.")
        market_caps[ticker] = market_cap
    else:
        print(f"Market cap for {ticker} not found.")

# Create a DataFrame to store the data
df = pd.DataFrame(list(market_caps.items()), columns=['Ticker', 'Market Cap'])
df.sort_values(by='Market Cap', ascending=False, inplace=True)
df.reset_index(drop=True, inplace=True)

# Find the largest company
top_company = df.iloc[0]

# Calculate the percentage increase needed for each of the smaller companies to overtake the top one
df['Percentage Increase Needed'] = ((top_company['Market Cap'] - df['Market Cap']) / df['Market Cap']) * 100

# Output the results
print(f"Top Company: {top_company['Ticker']} with a Market Cap of ${top_company['Market Cap']:,}")
print(df[['Ticker', 'Market Cap', 'Percentage Increase Needed']])
Market Capitalization and threshold
Once we have the market cap, we can calculate the percentage increase required for each company to exceed AAPL. Below is the output from the code above.
Top Company: AAPL with a Market Cap of $3,481,738,936,320.0
Ticker Market Cap Percentage Increase Needed
0 AAPL 3.481739e+12 0.000000
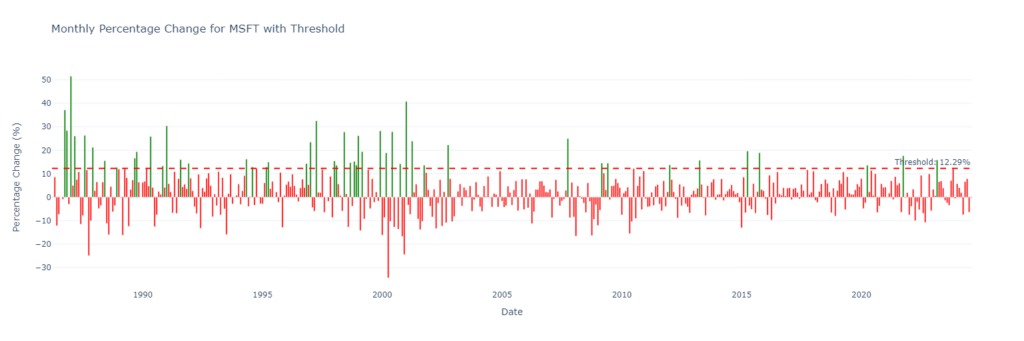
1 MSFT 3.100618e+12 12.291764
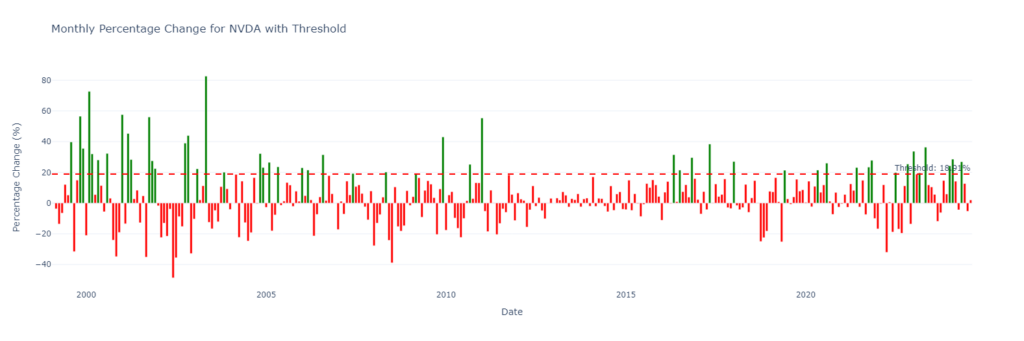
2 NVDA 2.928146e+12 18.905915
3 GOOG 2.020401e+12 72.329063
4 AMZN 1.873465e+12 85.844935
5 2222.SR 1.818538e+12 91.458086
6 META 1.318820e+12 164.004029
7 BRK-B 1.026412e+12 239.214585
8 LLY 8.644270e+11 302.779992
9 TSM 2.849440e+10 12119.030326Now that we know the percentage increases required, we can download all historical returns and see which companies have actually achieved this in a previous month.
import yfinance as yf
import pandas as pd
import plotly.graph_objects as go

# Assuming 'df' from the previous code cell contains the market cap data

# Download historical monthly data for each ticker
historical_data = {}
for ticker in df['Ticker']:
    stock_data = yf.download(ticker, start="1900-01-01", interval="1mo", auto_adjust=True)
    stock_data['Date'] = pd.to_datetime(stock_data.index)
    stock_data.set_index('Date', inplace=True)
    stock_data['Pct Change'] = stock_data['Close'].pct_change() * 100  # Convert to percentage change
    historical_data[ticker] = stock_data

# Identify the top company by ticker
top_ticker = df.iloc[0]['Ticker']

# Plotting the data with dynamic variables, but skipping the top company
for index, row in df.iterrows():
    ticker = row['Ticker']

    if ticker == top_ticker:
        continue  # Skip plotting for the top company

    threshold = row['Percentage Increase Needed']

    # Prepare the data for plotting
    stock_data = historical_data[ticker]

    # Create a bar chart with conditional coloring
    colors = ['green' if pct > threshold else 'red' for pct in stock_data['Pct Change']]

    fig = go.Figure(data=[go.Bar(
        x=stock_data.index,
        y=stock_data['Pct Change'],
        marker_color=colors
    )])

    # Add a red horizontal line at the threshold
    fig.add_hline(y=threshold, line_dash="dash", line_color="red",
                  annotation_text=f"Threshold: {threshold:.2f}%",
                  annotation_position="top right")

    # Customize layout
    fig.update_layout(
        title=f'Monthly Percentage Change for {ticker} with Threshold',
        xaxis_title='Date',
        yaxis_title='Percentage Change (%)',
        template='plotly_white'
    )

    # Show the plot
    fig.show()
This code outputs multiple graphs. However, only two companies—MSFT and NVDA—realistically have a chance to exceed AAPL’s market cap in the next month.
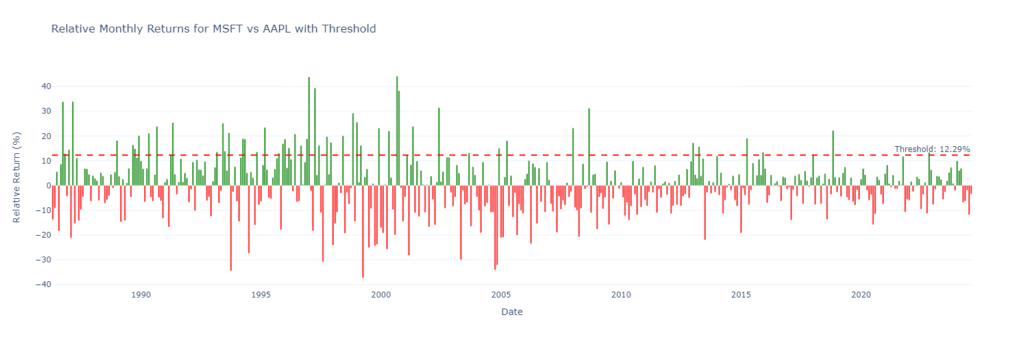
Relative Return
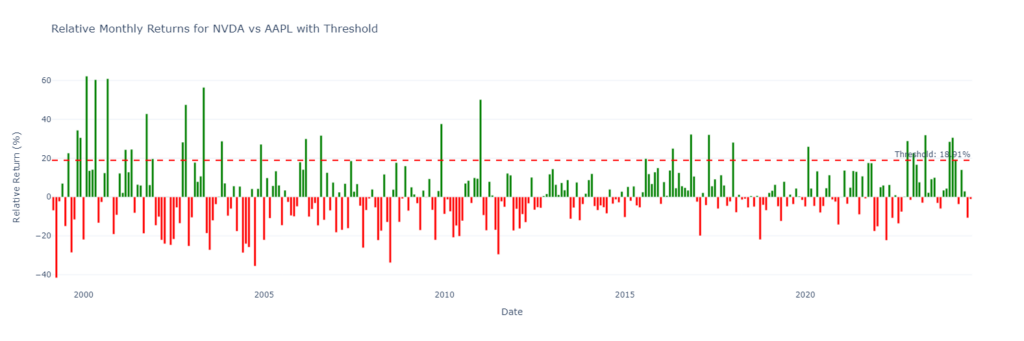
Instead of looking at NVDA’s return individually, I’ll examine the correlation between NVDA and AAPL by subtracting NVDA’s return from AAPL’s return for every month.
import plotly.graph_objects as go

# Assuming 'df' and 'historical_data' from the previous cells are still available

# Identify the top company by ticker
top_ticker = df.iloc[0]['Ticker']
top_stock_data = historical_data[top_ticker]

# Plotting the relative returns for each ticker compared to the top ticker, with threshold lines
for index, row in df.iterrows():
    ticker = row['Ticker']

    if ticker == top_ticker:
        continue  # Skip plotting for the top company

    threshold = row['Percentage Increase Needed']

    # Fetch the stock data for the current ticker
    stock_data = historical_data[ticker]

    # Align and truncate data to the earliest common date
    combined_data = pd.concat([top_stock_data['Pct Change'], stock_data['Pct Change']], axis=1, keys=[top_ticker, ticker]).dropna()

    # Subtract top stock's performance from the current stock's performance
    combined_data['Relative Return'] = combined_data[ticker] - combined_data[top_ticker]

    # Create a bar chart with conditional coloring
    colors = ['green' if pct > 0 else 'red' for pct in combined_data['Relative Return']]

    fig = go.Figure(data=[go.Bar(
        x=combined_data.index,
        y=combined_data['Relative Return'],
        marker_color=colors
    )])

    # Add a red horizontal line at the required threshold
    fig.add_hline(y=threshold, line_dash="dash", line_color="red",
                  annotation_text=f"Threshold: {threshold:.2f}%",
                  annotation_position="top right")

    # Customize layout
    fig.update_layout(
        title=f'Relative Monthly Returns for {ticker} vs {top_ticker} with Threshold',
        xaxis_title='Date',
        yaxis_title='Relative Return (%)',
        template='plotly_white'
    )

    # Show the plot
    fig.show()
Now, we can see the relative returns as well as the threshold of times they exceeded the required amount to surpass AAPL.
Distribution of Relative Returns
To view this data differently, we can now look at the distribution of this data. The code will loop through the last 10 years, but here is an example for one year:
### Analysis for the Last 1 Year(s) ###
NVDA exceeded the threshold 3 times.
NVDA Mean Relative Change: 7.4181%
NVDA Std Dev of Relative Change: 13.8239%
NVDA Z-score for threshold 18.91%: 0.8310
Probability of exceeding threshold based on distribution: 20.2984%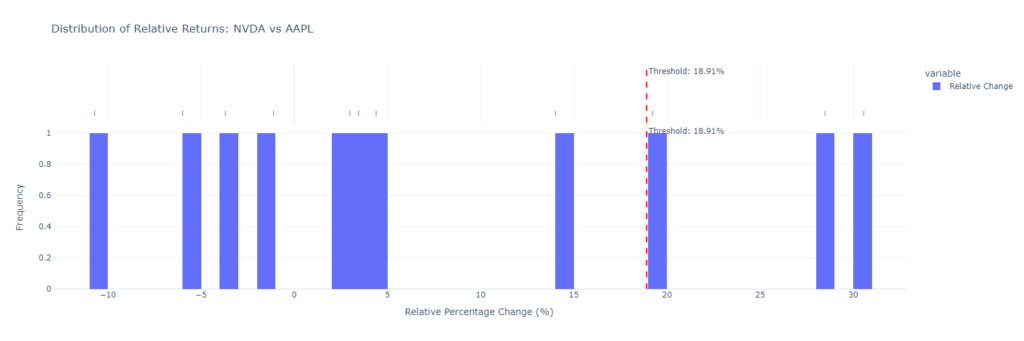
What is the expected value?
Now that we know the distribution and odds, we can introduce Polymarket’s implied odds—83% with a cost of 84 cents per share and a payout of 16 cents per share. Based on these inputs, we can convert this to Expected Value (EV).
Polymarket 'Yes' Probability: 83.00%
Polymarket 'Yes' Bet Cost: $0.84 per share
Polymarket 'Yes' Payout: $0.16 per share

### Summary for the Last 1 Year(s) ###
Months Analyzed: 12 months
Probability of Apple remaining the largest (based on exceedance rate): 75.00%
Probability of Apple remaining the largest (based on distribution): 79.7016%
Expected Value (EV) of betting 'Yes' on Polymarket (based on exceedance rate): $0.1200 per $1 bet
Expected Value (EV) of betting 'Yes' on Polymarket (based on distribution): $0.1275 per $1 bet
Based on the exceedance rate, for every $1 bet, you should expect to make $0.1200.
Based on the distribution, for every $1 bet, you should expect to make $0.1275.
import pandas as pd
from datetime import datetime
from scipy.stats import norm

# Given Polymarket values
polymarket_prob_yes = 0.83  # 83% chance of Apple remaining the largest
polymarket_price_yes = 0.84  # 84¢ to bet "Yes"
polymarket_payout_yes = 1 - polymarket_price_yes  # Payout for "Yes" bet

print(f"Polymarket 'Yes' Probability: {polymarket_prob_yes * 100:.2f}%")
print(f"Polymarket 'Yes' Bet Cost: ${polymarket_price_yes:.2f} per share")
print(f"Polymarket 'Yes' Payout: ${polymarket_payout_yes:.2f} per share")

# Assuming 'df', 'historical_data', and the correct top_ticker (Apple in this case) are available from previous code cells

# Loop over 1 to 10 years
for year in range(1, 11):
    print(f"\n### Summary for the Last {year} Year(s) ###")

    # Calculate the cutoff date for the current loop iteration
    cutoff_date = datetime.now() - pd.DateOffset(years=year)

    # Calculate the number of months in the specified period
    months_in_period = year * 12

    # Initialize a cumulative counter for exceedances and probabilities
    cumulative_exceedances = 0
    cumulative_prob_not_exceeding = 1  # Start with 1 (100% chance of no exceedance)

    # Iterate through the tickers in the df to calculate exceedances and probabilities
    for index, row in df.iterrows():
        ticker = row['Ticker']
        if ticker == top_ticker:
            continue  # Skip the top company itself

        # Fetch the stock data for the current ticker and truncate to the last N years
        stock_data = historical_data[ticker]
        stock_data_truncated = stock_data[stock_data.index >= cutoff_date]

        # Align and truncate data to the earliest common date
        combined_data = pd.concat([historical_data[top_ticker]['Pct Change'], stock_data_truncated['Pct Change']], axis=1, keys=[top_ticker, ticker]).dropna()

        # Subtract top stock's performance from the current stock's performance
        combined_data['Relative Change'] = combined_data[ticker] - combined_data[top_ticker]

        # Calculate how many times this stock exceeded the threshold (Frequency-Based Approach)
        exceedance_count = (combined_data['Relative Change'] >= row['Percentage Increase Needed']).sum()

        # If no exceedances, skip this ticker
        if exceedance_count == 0:
            continue

        # Add to the cumulative counter
        cumulative_exceedances += exceedance_count

        # Distribution and Standard Deviation Approach
        mean_relative_change = combined_data['Relative Change'].mean()
        std_relative_change = combined_data['Relative Change'].std()

        # Calculate the Z-score for the threshold
        z_score = (row['Percentage Increase Needed'] - mean_relative_change) / std_relative_change

        # Calculate the probability of exceeding the threshold using the CDF of the normal distribution
        prob_exceeding_threshold = 1 - norm.cdf(z_score)

        # Multiply with the cumulative probability of not exceeding the threshold (for all stocks)
        cumulative_prob_not_exceeding *= (1 - prob_exceeding_threshold)

    # Calculate the rate of exceedances per month (Frequency-Based Approach)
    exceedance_rate_per_month = cumulative_exceedances / months_in_period

    # Calculate the probability that Apple will remain the largest company based on the exceedance rate
    months_until_sept_30 = 1  # Assuming 1 month left until September 30
    prob_remain_largest_based_on_exceedance = 1 - (exceedance_rate_per_month * months_until_sept_30)

    # Calculate the cumulative probability that Apple will remain the largest based on the distribution
    prob_remain_largest_based_on_distribution = cumulative_prob_not_exceeding

    # EV calculation for the Polymarket bet (using exceedance rate)
    ev_polymarket_yes_exceedance_rate = prob_remain_largest_based_on_exceedance * polymarket_payout_yes

    # EV calculation for the Polymarket bet (using distribution-based probability)
    ev_polymarket_yes_distribution = prob_remain_largest_based_on_distribution * polymarket_payout_yes

    # Output the results for the current year
    print(f"Months Analyzed: {months_in_period} months")
    print(f"Probability of Apple remaining the largest (based on exceedance rate): {prob_remain_largest_based_on_exceedance:.2%}")
    print(f"Probability of Apple remaining the largest (based on distribution): {prob_remain_largest_based_on_distribution:.4%}")
    print(f"Expected Value (EV) of betting 'Yes' on Polymarket (based on exceedance rate): ${ev_polymarket_yes_exceedance_rate:.4f} per $1 bet")
    print(f"Expected Value (EV) of betting 'Yes' on Polymarket (based on distribution): ${ev_polymarket_yes_distribution:.4f} per $1 bet")

    # Summary of recommendation
    if ev_polymarket_yes_exceedance_rate > 0:
        print(f"Based on the exceedance rate, for every $1 bet, you should expect to make ${ev_polymarket_yes_exceedance_rate:.4f}.")
    else:
        print(f"Based on the exceedance rate, this bet may not be favorable, as you would expect to lose ${abs(ev_polymarket_yes_exceedance_rate):.4f} per $1 bet.")

    if ev_polymarket_yes_distribution > 0:
        print(f"Based on the distribution, for every $1 bet, you should expect to make ${ev_polymarket_yes_distribution:.4f}.")
    else:
        print(f"Based on the distribution, this bet may not be favorable, as you would expect to lose ${abs(ev_polymarket_yes_distribution):.4f} per $1 bet.")
Should You Bet “Yes”?
Essentially, we can analyze various years of data to determine how likely it is that NVDA will dethrone AAPL. Based on the output below, which analyzes data from 1 to 10 years, it turns out that betting “Yes” on AAPL retaining the largest market cap into October 2024 could be favorable. However, the EV isn’t significant, so I wouldn’t wager a large sum of money on this bet.
Polymarket 'Yes' Probability: 83.00%
Polymarket 'Yes' Bet Cost: $0.84 per share
Polymarket 'Yes' Payout: $0.16 per share

### Summary for the Last 1 Year(s) ###
Months Analyzed: 12 months
Exceedance Rate: 0.25 exceedances per month
Probability of Apple remaining the largest (based on exceedance rate): 75.00%
Probability of at least one stock exceeding the threshold (distribution-based): 20.2984%
Expected Value (EV) of betting 'Yes' on Polymarket (based on exceedance rate): $0.1200 per $1 bet
Expected Value (EV) of betting 'Yes' on Polymarket (based on distribution): $0.0325 per $1 bet
Based on the exceedance rate, for every $1 bet, you should expect to make $0.1200.
Based on the distribution, for every $1 bet, you should expect to make $0.0325.

### Summary for the Last 2 Year(s) ###
Months Analyzed: 24 months
Exceedance Rate: 0.29 exceedances per month
Probability of Apple remaining the largest (based on exceedance rate): 70.83%
Probability of at least one stock exceeding the threshold (distribution-based): 24.5599%
Expected Value (EV) of betting 'Yes' on Polymarket (based on exceedance rate): $0.1133 per $1 bet
Expected Value (EV) of betting 'Yes' on Polymarket (based on distribution): $0.0393 per $1 bet
Based on the exceedance rate, for every $1 bet, you should expect to make $0.1133.
Based on the distribution, for every $1 bet, you should expect to make $0.0393.

### Summary for the Last 3 Year(s) ###
Months Analyzed: 36 months
Exceedance Rate: 0.19 exceedances per month
Probability of Apple remaining the largest (based on exceedance rate): 80.56%
Probability of at least one stock exceeding the threshold (distribution-based): 18.1044%
Expected Value (EV) of betting 'Yes' on Polymarket (based on exceedance rate): $0.1289 per $1 bet
Expected Value (EV) of betting 'Yes' on Polymarket (based on distribution): $0.0290 per $1 bet
Based on the exceedance rate, for every $1 bet, you should expect to make $0.1289.
Based on the distribution, for every $1 bet, you should expect to make $0.0290.

### Summary for the Last 4 Year(s) ###
Months Analyzed: 48 months
Exceedance Rate: 0.15 exceedances per month
Probability of Apple remaining the largest (based on exceedance rate): 85.42%
Probability of at least one stock exceeding the threshold (distribution-based): 14.3875%
Expected Value (EV) of betting 'Yes' on Polymarket (based on exceedance rate): $0.1367 per $1 bet
Expected Value (EV) of betting 'Yes' on Polymarket (based on distribution): $0.0230 per $1 bet
Based on the exceedance rate, for every $1 bet, you should expect to make $0.1367.
Based on the distribution, for every $1 bet, you should expect to make $0.0230.

### Summary for the Last 5 Year(s) ###
Months Analyzed: 60 months
Exceedance Rate: 0.13 exceedances per month
Probability of Apple remaining the largest (based on exceedance rate): 86.67%
Probability of at least one stock exceeding the threshold (distribution-based): 12.8382%
Expected Value (EV) of betting 'Yes' on Polymarket (based on exceedance rate): $0.1387 per $1 bet
Expected Value (EV) of betting 'Yes' on Polymarket (based on distribution): $0.0205 per $1 bet
Based on the exceedance rate, for every $1 bet, you should expect to make $0.1387.
Based on the distribution, for every $1 bet, you should expect to make $0.0205.

### Summary for the Last 6 Year(s) ###
Months Analyzed: 72 months
Exceedance Rate: 0.12 exceedances per month
Probability of Apple remaining the largest (based on exceedance rate): 87.50%
Probability of at least one stock exceeding the threshold (distribution-based): 11.3315%
Expected Value (EV) of betting 'Yes' on Polymarket (based on exceedance rate): $0.1400 per $1 bet
Expected Value (EV) of betting 'Yes' on Polymarket (based on distribution): $0.0181 per $1 bet
Based on the exceedance rate, for every $1 bet, you should expect to make $0.1400.
Based on the distribution, for every $1 bet, you should expect to make $0.0181.

### Summary for the Last 7 Year(s) ###
Months Analyzed: 84 months
Exceedance Rate: 0.12 exceedances per month
Probability of Apple remaining the largest (based on exceedance rate): 88.10%
Probability of at least one stock exceeding the threshold (distribution-based): 10.4131%
Expected Value (EV) of betting 'Yes' on Polymarket (based on exceedance rate): $0.1410 per $1 bet
Expected Value (EV) of betting 'Yes' on Polymarket (based on distribution): $0.0167 per $1 bet
Based on the exceedance rate, for every $1 bet, you should expect to make $0.1410.
Based on the distribution, for every $1 bet, you should expect to make $0.0167.

### Summary for the Last 8 Year(s) ###
Months Analyzed: 96 months
Exceedance Rate: 0.12 exceedances per month
Probability of Apple remaining the largest (based on exceedance rate): 87.50%
Probability of at least one stock exceeding the threshold (distribution-based): 11.5422%
Expected Value (EV) of betting 'Yes' on Polymarket (based on exceedance rate): $0.1400 per $1 bet
Expected Value (EV) of betting 'Yes' on Polymarket (based on distribution): $0.0185 per $1 bet
Based on the exceedance rate, for every $1 bet, you should expect to make $0.1400.
Based on the distribution, for every $1 bet, you should expect to make $0.0185.

### Summary for the Last 9 Year(s) ###
Months Analyzed: 108 months
Exceedance Rate: 0.13 exceedances per month
Probability of Apple remaining the largest (based on exceedance rate): 87.04%
Probability of at least one stock exceeding the threshold (distribution-based): 12.1167%
Expected Value (EV) of betting 'Yes' on Polymarket (based on exceedance rate): $0.1393 per $1 bet
Expected Value (EV) of betting 'Yes' on Polymarket (based on distribution): $0.0194 per $1 bet
Based on the exceedance rate, for every $1 bet, you should expect to make $0.1393.
Based on the distribution, for every $1 bet, you should expect to make $0.0194.

### Summary for the Last 10 Year(s) ###
Months Analyzed: 120 months
Exceedance Rate: 0.13 exceedances per month
Probability of Apple remaining the largest (based on exceedance rate): 86.67%
Probability of at least one stock exceeding the threshold (distribution-based): 11.7986%
Expected Value (EV) of betting 'Yes' on Polymarket (based on exceedance rate): $0.1387 per $1 bet
Expected Value (EV) of betting 'Yes' on Polymarket (based on distribution): $0.0189 per $1 bet
Based on the exceedance rate, for every $1 bet, you should expect to make $0.1387.
Based on the distribution, for every $1 bet, you should expect to make $0.0189.
Source Code
The source code can be found here to run your own analysis.