
Polymarket.com, a prediction market platform, operates on the Ethereum blockchain through the Polygon network, making it possible to analyze user transactions directly from the blockchain. By accessing a user’s wallet address, we can examine their trades in detail, track profit/loss, and monitor position changes over time. In this post, I’ll show how you can leverage the Polygon blockchain data to analyze trades on Polymarket using wallet IDs and some helpful Python code.
Below are examples of the kinds of charts the script generates and their significance.
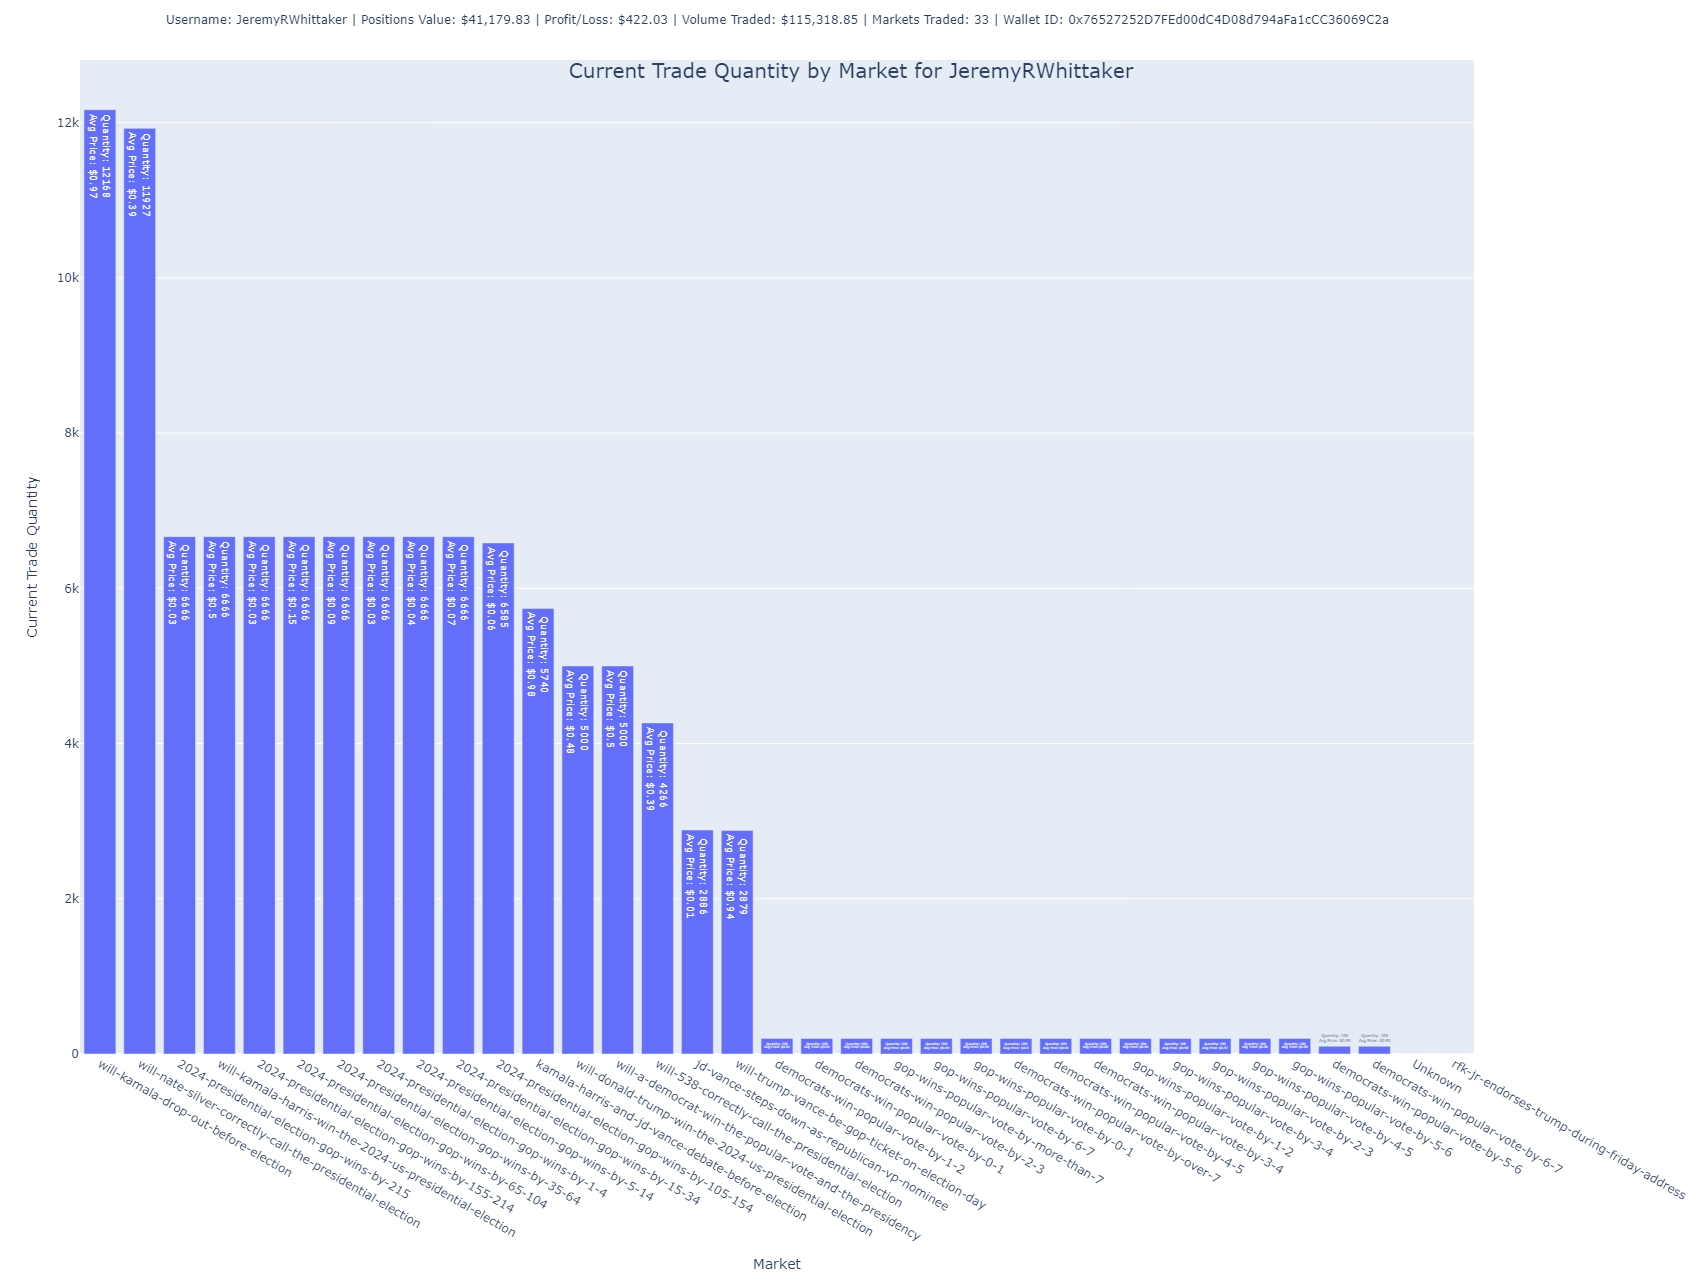
Shares by Market
This chart focuses on the number of shares the user holds across different markets. It’s another way to visualize their exposure to various outcomes but focuses on the number of shares rather than their total purchase value.
Insight: Larger bars suggest higher exposure to specific markets. The average price paid per share is also annotated, providing further context.
Purpose: Useful for understanding the user’s position size in each market.
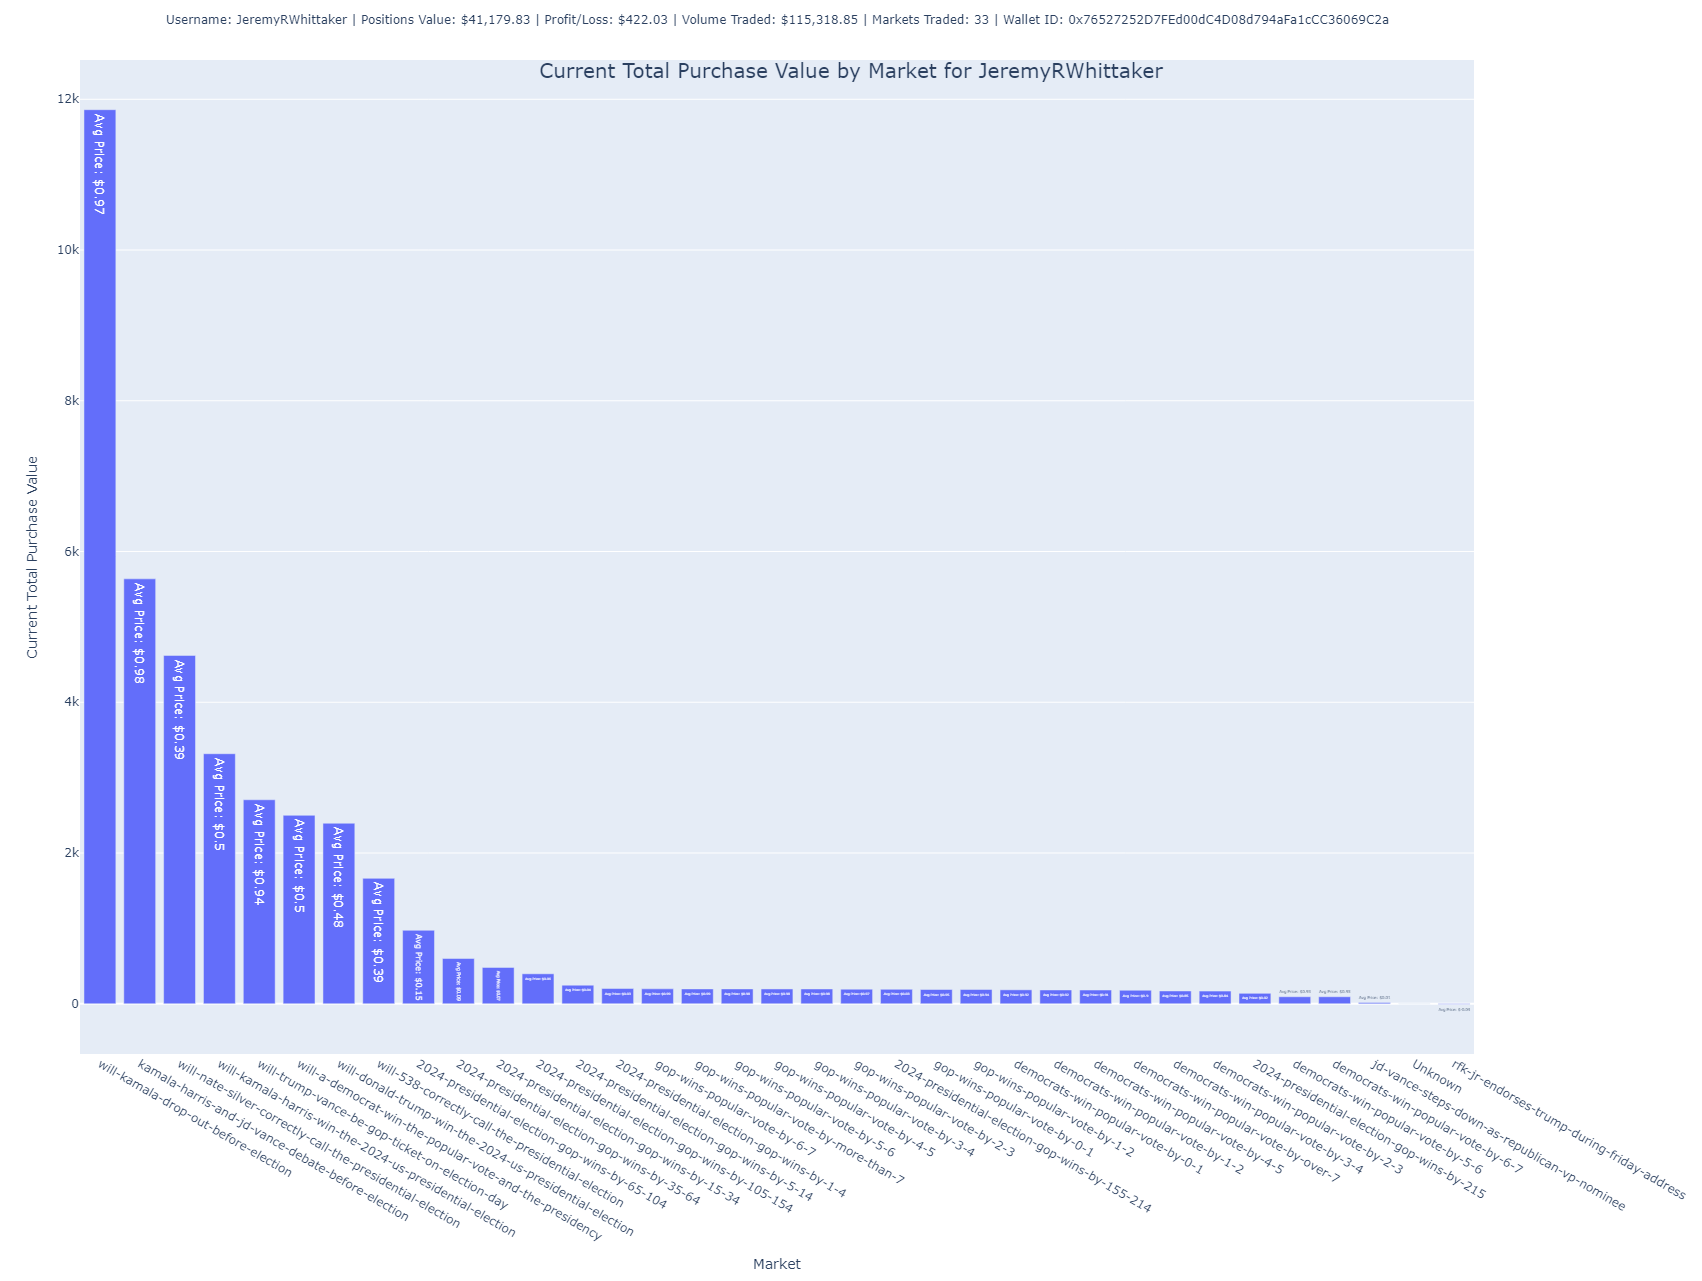
Total Purchase Value by Market
In this bar chart, the user’s total purchase value is broken down by market. The height of each bar indicates how much the user has invested in each specific market.
- Purpose: It allows for a clear visualization of where the user is concentrating their funds, showing which markets hold the largest portion of their portfolio.
- Insight: The accompanying labels provide information about the average price paid per share in each market, helping understand whether the user is buying low or high within a market.
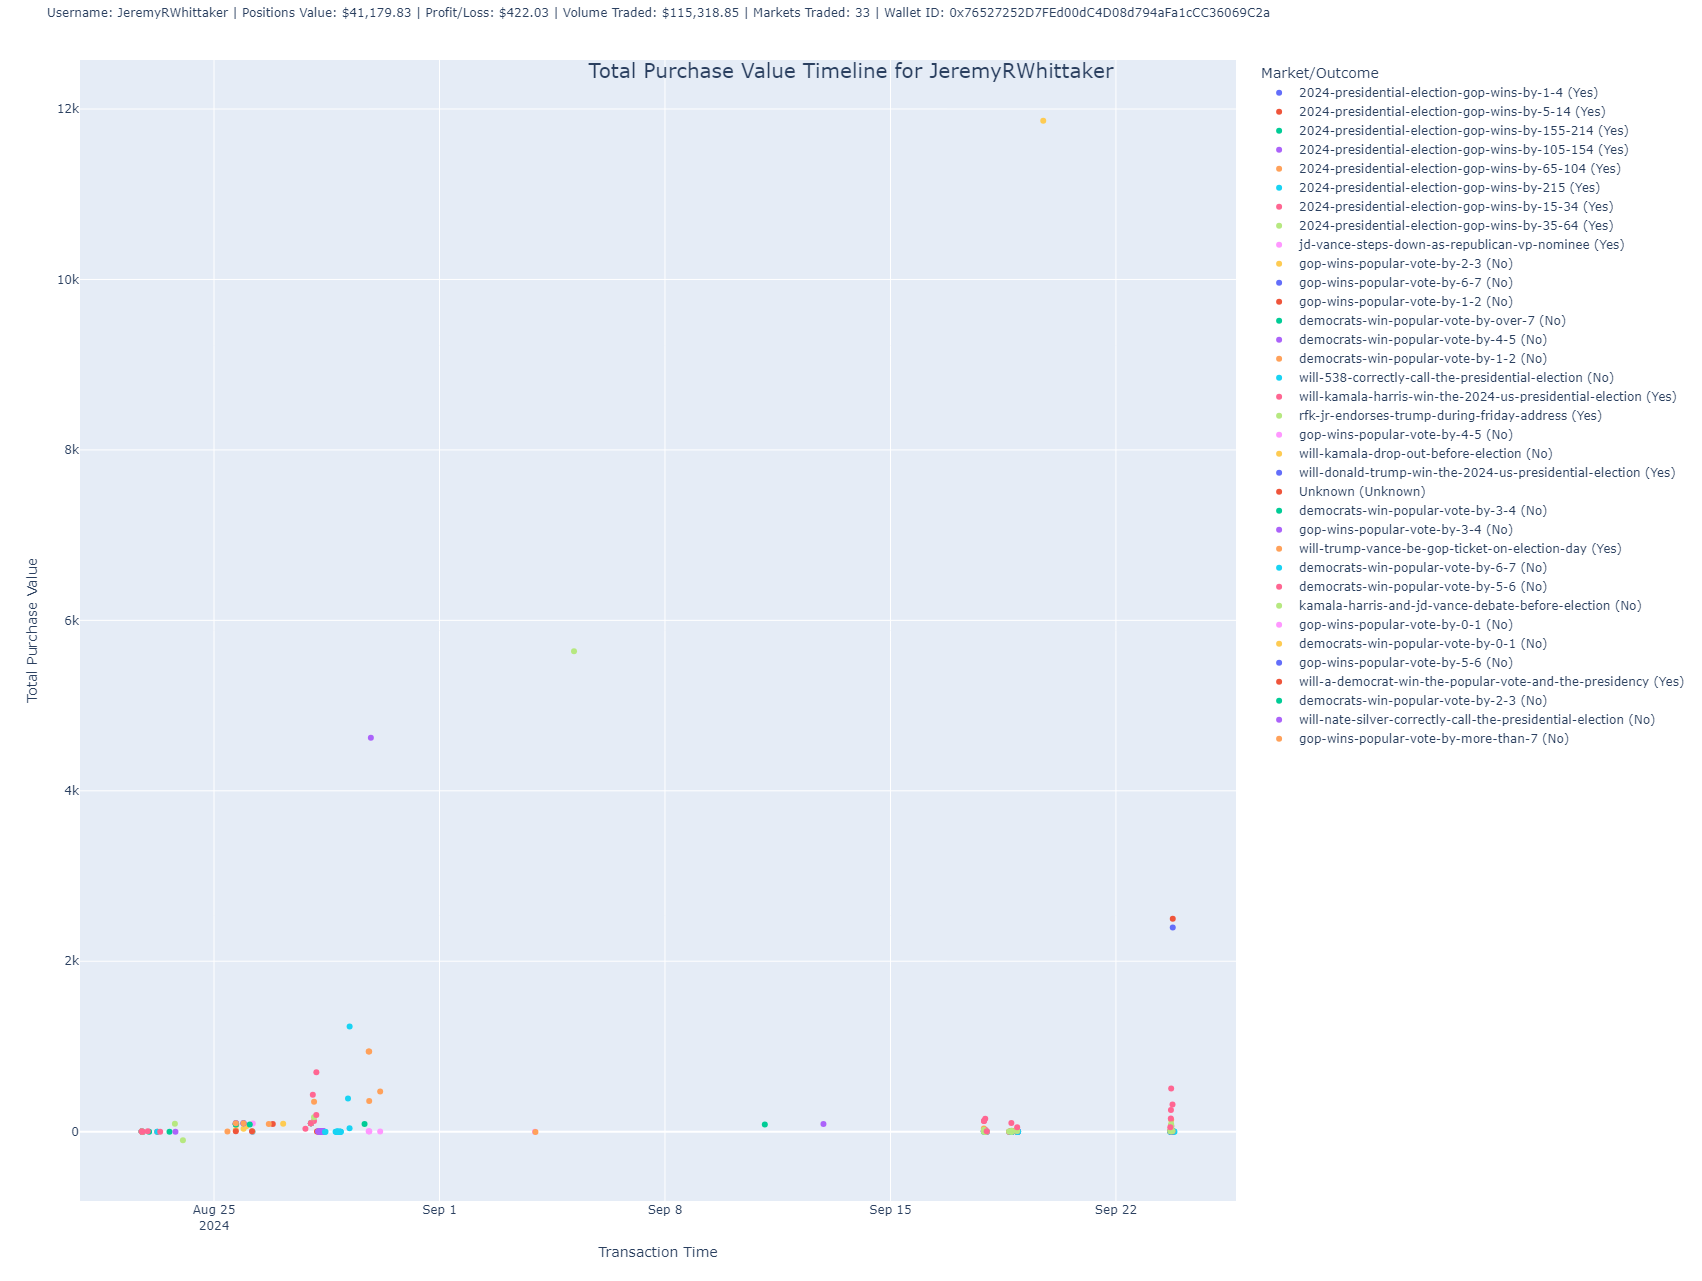
Total Purchase Value Timeline
This scatter plot shows the timeline of the user’s trades by plotting the total purchase value of trades over time.
- Purpose: This chart reveals when the user made their largest investments, showing the fluctuations in purchase value across trades.
- Insight: Each dot represents a trade, with its position on the Y-axis showing the value and on the X-axis showing the timestamp of the transaction. You can use this chart to understand when the user made big moves in the market.
Holdings by Market and Outcome (Treemap)
The treemap provides a more detailed look at the user’s holdings, breaking down their positions by both market and outcome. Each rectangle represents the shares held in a particular market-outcome pair, with the size of the rectangle proportional to the user’s investment.
- Purpose: Ideal for visually assessing how much the user has allocated to each market and outcome combination.
- Insight: It highlights not just which markets the user has invested in but also how they’ve distributed their bets across different outcomes within those markets.

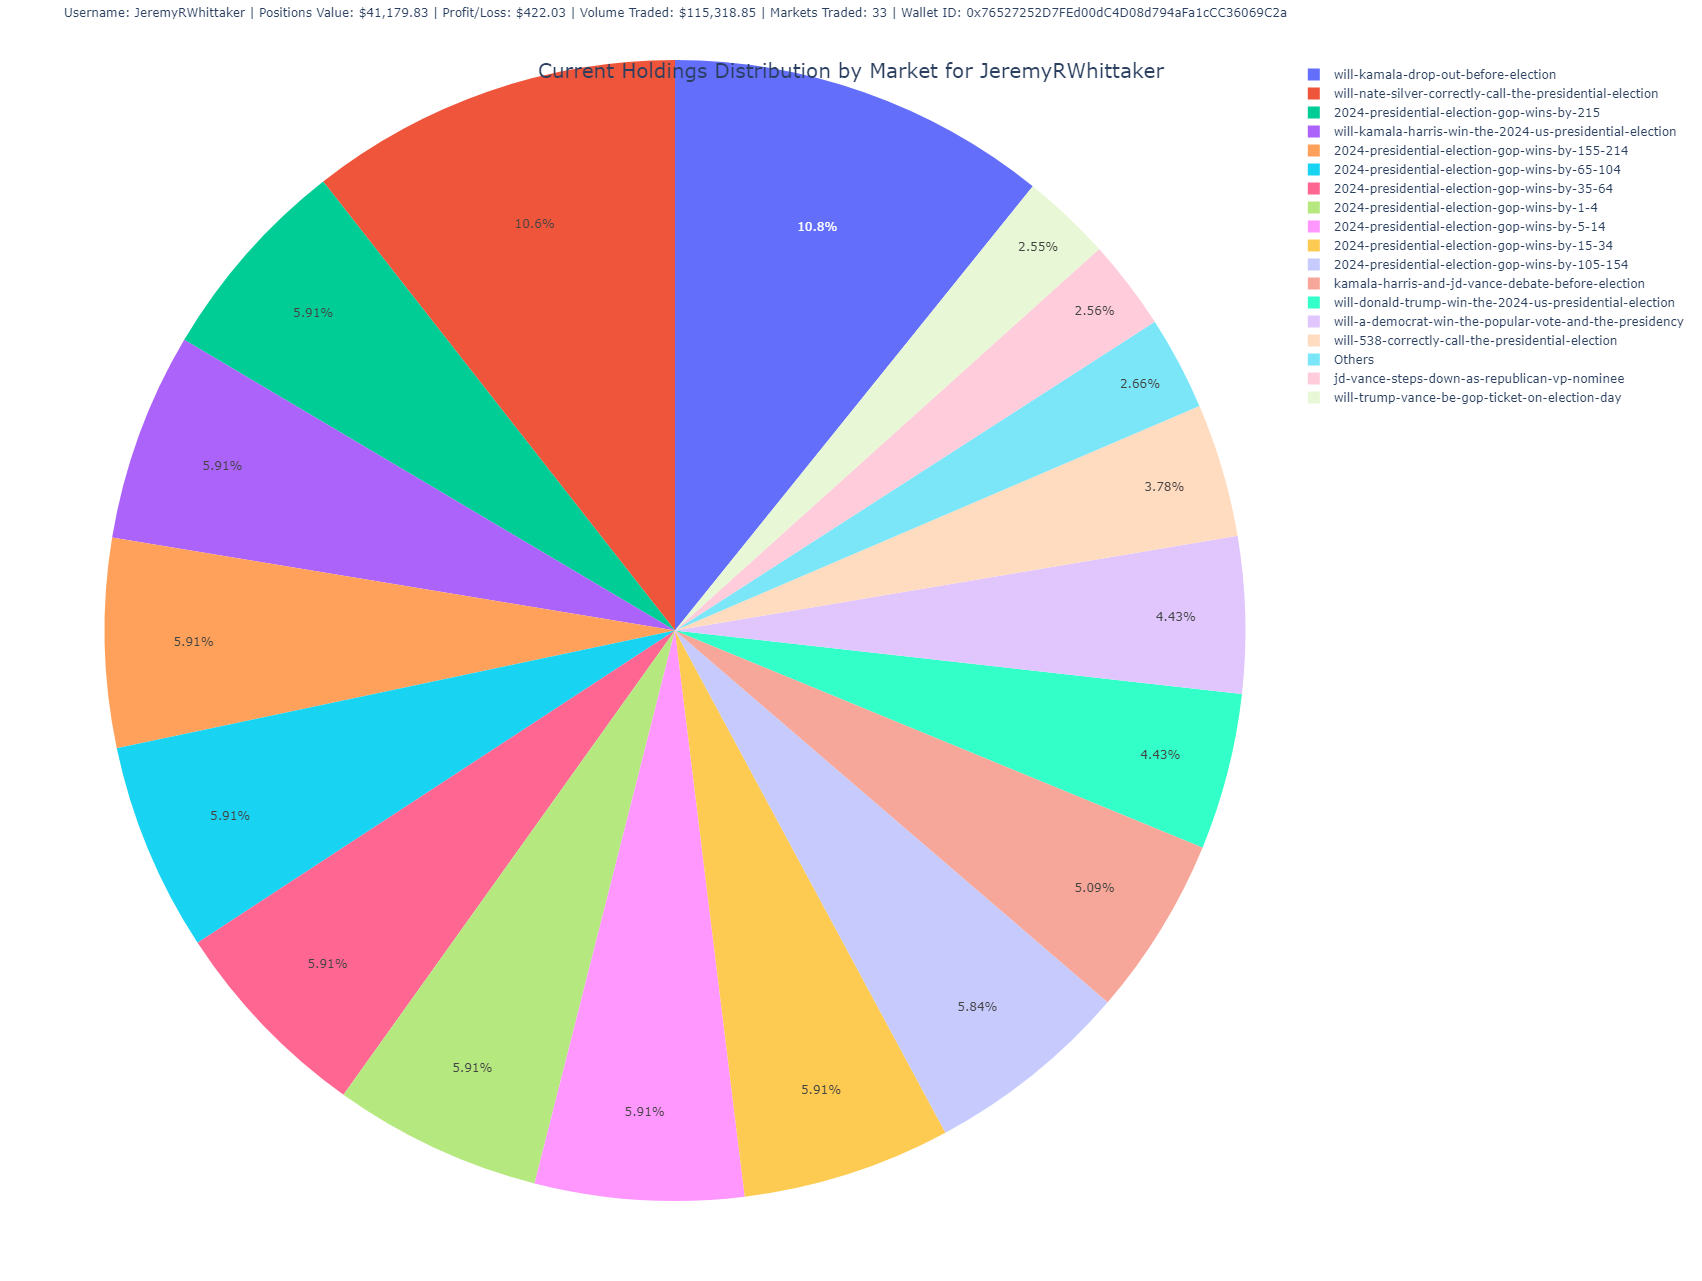
Holdings Distribution by Market (Pie Chart)
This pie chart visualizes the user’s current holdings, showing the percentage distribution of shares across different markets.
- Purpose: Offers a high-level overview of the user’s portfolio diversification across different markets.
- Insight: Larger slices indicate heavier investments in specific markets, allowing you to quickly see where the user has concentrated their bets.
Cumulative Shares Over Time
This line chart tracks the cumulative number of shares held by the user in various markets over time. It helps visualize when the user bought or sold shares and how their position has evolved in each market.
- Purpose: This chart is essential for understanding the user’s trading strategy over time, revealing periods of heavy buying or selling.
- Insight: Each line represents a different market and outcome combination. Peaks in the lines indicate increased positions, while dips show reductions or sales.

The Code
The code behind these charts fetches data from Polygon’s blockchain and processes the transactions associated with a given wallet ID. It retrieves ERC-1155 and ERC-20 token transaction data, enriches it with market information, and generates visual insights based on trading activity. You can use this code to analyze any Polymarket user’s trades simply by knowing their wallet address.
Here’s a breakdown of the main functions:
fetch_user_transactions(wallet_address, api_key): Fetches all ERC-1155 and ERC-20 transactions for a given wallet from Polygon.add_financial_columns(): Processes transactions to calculate key financial metrics like profit/loss, total purchase value, and shares held.plot_profit_loss_by_trade(): Generates a bar plot showing profit or loss for each trade.plot_shares_over_time(): Creates a line plot showing cumulative shares over time.create_and_save_pie_chart(): Generates a pie chart that breaks down holdings by market.create_and_save_treemap(): Produces a treemap for holdings based on market and outcome.plot_total_purchase_value(): Generates a scatter plot showing total purchase value over time.
This tool offers deep insights into any user’s trading behavior and performance on Polymarket.
import os
import requests
import logging
import pandas as pd
import subprocess
import json
import time
from dotenv import load_dotenv
import plotly.express as px
import re
from bs4 import BeautifulSoup
from importlib import reload
import numpy as np
import argparse
import os
import subprocess
import json
import logging
import pandas as pd
from dotenv import load_dotenv
logging.basicConfig(level=logging.DEBUG, format='%(asctime)s - %(levelname)s - %(message)s')
logger = logging.getLogger(__name__)
# Load environment variables
load_dotenv("keys.env")
price_cache = {}
# EXCHANGES
CTF_EXCHANGE = '0x2791Bca1f2de4661ED88A30C99A7a9449Aa84174'
NEG_RISK_CTF_EXCHANGE = '0x4d97dcd97ec945f40cf65f87097ace5ea0476045'
# SPENDERS FOR EXCHANGES
NEG_RISK_CTF_EXCHANGE_SPENDER = '0xC5d563A36AE78145C45a50134d48A1215220f80a'
NEG_RISK_ADAPTER = '0xd91E80cF2E7be2e162c6513ceD06f1dD0dA35296'
CTF_EXCHANGE_SPENDER = '0x4bFb41d5B3570DeFd03C39a9A4D8dE6Bd8B8982E'
CACHE_EXPIRATION_TIME = 60 * 30 # Cache expiration time in seconds (5 minutes)
PRICE_CACHE_FILE = './data/live_price_cache.json'
# Dictionary to cache live prices
live_price_cache = {}
def load_price_cache():
"""Load the live price cache from a JSON file."""
if os.path.exists(PRICE_CACHE_FILE):
try:
with open(PRICE_CACHE_FILE, 'r') as file:
return json.load(file)
except json.JSONDecodeError as e:
logger.error(f"Error loading price cache: {e}")
return {}
return {}
def save_price_cache(cache):
"""Save the live price cache to a JSON file."""
with open(PRICE_CACHE_FILE, 'w') as file:
json.dump(cache, file)
def is_cache_valid(cache_entry, expiration_time=CACHE_EXPIRATION_TIME):
"""
Check if the cache entry is still valid based on the current time and expiration time.
"""
if not cache_entry:
return False
cached_time = cache_entry.get('timestamp', 0)
return (time.time() - cached_time) < expiration_time
def call_get_live_price(token_id, expiration_time=CACHE_EXPIRATION_TIME):
"""
Get live price from cache or update it if expired.
"""
logger.info(f'Getting live price for token {token_id}')
# Load existing cache
price_cache = load_price_cache()
cache_key = f"{token_id}"
# Check if cache is valid
if cache_key in price_cache and is_cache_valid(price_cache[cache_key], expiration_time):
logger.info(f'Returning cached price for {cache_key}')
return price_cache[cache_key]['price']
# If cache is expired or doesn't exist, fetch live price
try:
result = subprocess.run(
['python3', 'get_live_price.py', token_id],
stdout=subprocess.PIPE,
stderr=subprocess.PIPE,
text=True,
check=True
)
# Parse the live price from the subprocess output
output_lines = result.stdout.strip().split("\n")
live_price_line = next((line for line in output_lines if "Live price for token" in line), None)
if live_price_line:
live_price = float(live_price_line.strip().split(":")[-1].strip())
else:
logger.error("Live price not found in subprocess output.")
return None
logger.debug(f"Subprocess get_live_price output: {result.stdout}")
# Update cache with the new price and timestamp
price_cache[cache_key] = {'price': live_price, 'timestamp': time.time()}
save_price_cache(price_cache)
return live_price
except subprocess.CalledProcessError as e:
logger.error(f"Subprocess get_live_price error: {e.stderr}")
return None
except Exception as e:
logger.error(f"Error fetching live price: {str(e)}")
return None
def update_live_price_and_pl(merged_df, contract_token_id, market_slug=None, outcome=None):
"""
Calculate the live price and profit/loss (pl) for each trade in the DataFrame.
"""
# Ensure tokenID in merged_df is string
merged_df['tokenID'] = merged_df['tokenID'].astype(str)
contract_token_id = str(contract_token_id)
# Check for NaN or empty token IDs
if not contract_token_id or contract_token_id == 'nan':
logger.warning("Encountered NaN or empty contract_token_id. Skipping.")
return merged_df
# Add live_price and pl columns if they don't exist
if 'live_price' not in merged_df.columns:
merged_df['live_price'] = np.nan
if 'pl' not in merged_df.columns:
merged_df['pl'] = np.nan
# Filter rows with the same contract_token_id and outcome
merged_df['outcome'] = merged_df['outcome'].astype(str)
matching_rows = merged_df[(merged_df['tokenID'] == contract_token_id) &
(merged_df['outcome'].str.lower() == outcome.lower())]
if not matching_rows.empty:
logger.info(f'Fetching live price for token {contract_token_id}')
live_price = call_get_live_price(contract_token_id)
logger.info(f'Live price for token {contract_token_id}: {live_price}')
if live_price is not None:
try:
# Calculate profit/loss based on the live price
price_paid_per_token = matching_rows['price_paid_per_token']
total_purchase_value = matching_rows['total_purchase_value']
pl = ((live_price - price_paid_per_token) / price_paid_per_token) * total_purchase_value
# Update the DataFrame with live price and pl
merged_df.loc[matching_rows.index, 'live_price'] = live_price
merged_df.loc[matching_rows.index, 'pl'] = pl
except Exception as e:
logger.error(f"Error calculating live price and profit/loss: {e}")
else:
logger.warning(f"Live price not found for tokenID {contract_token_id}")
merged_df.loc[matching_rows.index, 'pl'] = np.nan
return merged_df
def find_token_id(market_slug, outcome, market_lookup):
"""Find the token_id based on market_slug and outcome."""
for market in market_lookup.values():
if market['market_slug'] == market_slug:
for token in market['tokens']:
if token['outcome'].lower() == outcome.lower():
return token['token_id']
return None
def fetch_data(url):
"""Fetch data from a given URL and return the JSON response."""
try:
response = requests.get(url, timeout=10) # You can specify a timeout
response.raise_for_status() # Raise an error for bad responses (4xx, 5xx)
return response.json()
except requests.exceptions.RequestException as e:
logger.error(f"Error fetching data from URL: {url}. Exception: {e}")
return None
def fetch_all_pages(api_key, token_ids, market_slug_outcome_map, csv_output_dir='./data/polymarket_trades/'):
page = 1
offset = 100
retry_attempts = 0
all_data = [] # Store all data here
while True:
url = f"https://api.polygonscan.com/api?module=account&action=token1155tx&contractaddress={NEG_RISK_CTF_EXCHANGE}&page={page}&offset={offset}&startblock=0&endblock=99999999&sort=desc&apikey={api_key}"
logger.info(f"Fetching transaction data for tokens {token_ids}, page: {page}")
data = fetch_data(url)
if data and data['status'] == '1':
df = pd.DataFrame(data['result'])
if df.empty:
logger.info("No more transactions found, ending pagination.")
break # Exit if there are no more transactions
all_data.append(df)
page += 1 # Go to the next page
else:
logger.error(f"API response error or no data found for page {page}")
if retry_attempts < 5:
retry_attempts += 1
time.sleep(retry_attempts)
else:
break
if all_data:
final_df = pd.concat(all_data, ignore_index=True) # Combine all pages
logger.info(f"Fetched {len(final_df)} transactions across all pages.")
return final_df
return None
def validate_market_lookup(token_ids, market_lookup):
valid_token_ids = []
invalid_token_ids = []
for token_id in token_ids:
market_slug, outcome = find_market_info(token_id, market_lookup)
if market_slug and outcome:
valid_token_ids.append(token_id)
else:
invalid_token_ids.append(token_id)
logger.info(f"Valid token IDs: {valid_token_ids}")
if invalid_token_ids:
logger.warning(f"Invalid or missing market info for token IDs: {invalid_token_ids}")
return valid_token_ids
def sanitize_filename(filename):
"""
Sanitize the filename by removing or replacing invalid characters.
"""
# Replace invalid characters with an underscore
return re.sub(r'[\\/*?:"<>|]', '_', filename)
def sanitize_directory(directory):
"""
Sanitize the directory name by removing or replacing invalid characters.
"""
# Replace invalid characters with an underscore
return re.sub(r'[\\/*?:"<>|]', '_', directory)
def extract_wallet_ids(leaderboard_url):
"""Scrape the Polymarket leaderboard to extract wallet IDs."""
logging.info(f"Fetching leaderboard page: {leaderboard_url}")
response = requests.get(leaderboard_url)
if response.status_code != 200:
logging.error(f"Failed to load page {leaderboard_url}, status code: {response.status_code}")
return []
logging.debug(f"Page loaded successfully, status code: {response.status_code}")
soup = BeautifulSoup(response.content, 'html.parser')
logging.debug("Page content parsed with BeautifulSoup")
wallet_ids = []
# Debug: Check if <a> tags are being found correctly
a_tags = soup.find_all('a', href=True)
logging.debug(f"Found {len(a_tags)} <a> tags in the page.")
for a_tag in a_tags:
href = a_tag['href']
logging.debug(f"Processing href: {href}")
if href.startswith('/profile/'):
wallet_id = href.split('/')[-1]
wallet_ids.append(wallet_id)
logging.info(f"Extracted wallet ID: {wallet_id}")
else:
logging.debug(f"Skipped href: {href}")
return wallet_ids
def load_market_lookup(json_path):
"""Load market lookup data from a JSON file."""
with open(json_path, 'r') as json_file:
return json.load(json_file)
def find_market_info(token_id, market_lookup):
"""Find market_slug and outcome based on tokenID."""
token_id = str(token_id) # Ensure token_id is a string
if not token_id or token_id == 'nan':
logger.warning("Token ID is NaN or empty. Skipping lookup.")
return None, None
logger.debug(f"Looking up market info for tokenID: {token_id}")
for market in market_lookup.values():
for token in market['tokens']:
if str(token['token_id']) == token_id:
logger.debug(
f"Found market info for tokenID {token_id}: market_slug = {market['market_slug']}, outcome = {token['outcome']}")
return market['market_slug'], token['outcome']
logger.warning(f"No market info found for tokenID: {token_id}")
return None, None
def fetch_data(url):
"""Fetch data from a given URL and return the JSON response."""
response = requests.get(url)
return response.json()
def save_to_csv(filename, data, headers, output_dir):
"""Save data to a CSV file in the specified output directory."""
filepath = os.path.join(output_dir, filename)
with open(filepath, 'w', newline='') as file:
writer = csv.DictWriter(file, fieldnames=headers)
writer.writeheader()
for entry in data:
writer.writerow(entry)
logger.info(f"Saved data to {filepath}")
def add_timestamps(erc1155_df, erc20_df):
"""
Rename timestamp columns and convert them from UNIX to datetime.
"""
# Rename the timestamp columns to avoid conflicts during merge
erc1155_df.rename(columns={'timeStamp': 'timeStamp_erc1155'}, inplace=True)
erc20_df.rename(columns={'timeStamp': 'timeStamp_erc20'}, inplace=True)
# Convert UNIX timestamps to datetime format
erc1155_df['timeStamp_erc1155'] = pd.to_numeric(erc1155_df['timeStamp_erc1155'], errors='coerce')
erc20_df['timeStamp_erc20'] = pd.to_numeric(erc20_df['timeStamp_erc20'], errors='coerce')
erc1155_df['timeStamp_erc1155'] = pd.to_datetime(erc1155_df['timeStamp_erc1155'], unit='s', errors='coerce')
erc20_df['timeStamp_erc20'] = pd.to_datetime(erc20_df['timeStamp_erc20'], unit='s', errors='coerce')
return erc1155_df, erc20_df
def enrich_erc1155_data(erc1155_df, market_lookup):
"""
Enrich the ERC-1155 DataFrame with market_slug and outcome based on market lookup.
"""
def get_market_info(token_id):
if pd.isna(token_id) or str(token_id) == 'nan':
return 'Unknown', 'Unknown'
for market in market_lookup.values():
for token in market['tokens']:
if str(token['token_id']) == str(token_id):
return market['market_slug'], token['outcome']
return 'Unknown', 'Unknown'
erc1155_df['market_slug'], erc1155_df['outcome'] = zip(
*erc1155_df['tokenID'].apply(lambda x: get_market_info(x))
)
return erc1155_df
def get_transaction_details_by_hash(transaction_hash, api_key, output_dir='./data/polymarket_trades/'):
"""
Fetch the transaction details by hash from Polygonscan, parse the logs, and save the flattened data as a CSV.
Args:
- transaction_hash (str): The hash of the transaction.
- api_key (str): The Polygonscan API key.
- output_dir (str): The directory to save the CSV file.
Returns:
- None: Saves the transaction details to a CSV.
"""
# Ensure output directory exists
os.makedirs(output_dir, exist_ok=True)
# Construct the API URL for fetching transaction receipt details by hash
url = f"https://api.polygonscan.com/api?module=proxy&action=eth_getTransactionReceipt&txhash={transaction_hash}&apikey={api_key}"
logger.info(f"Fetching transaction details for hash: {transaction_hash}")
logger.debug(f"Request URL: {url}")
try:
# Fetch transaction details
response = requests.get(url)
logger.debug(f"Polygonscan API response status: {response.status_code}")
if response.status_code != 200:
logger.error(f"Non-200 status code received: {response.status_code}")
return None
# Parse the JSON response
data = response.json()
logger.debug(f"Response JSON: {data}")
# Check if the status is successful
if data.get('result') is None:
logger.error(f"Error in API response: {data.get('message', 'Unknown error')}")
return None
# Extract the logs
logs = data['result']['logs']
logs_df = pd.json_normalize(logs)
# Save the logs to a CSV file for easier review
csv_filename = os.path.join(output_dir, f"transaction_logs_{transaction_hash}.csv")
logs_df.to_csv(csv_filename, index=False)
logger.info(f"Parsed logs saved to {csv_filename}")
return logs_df
except Exception as e:
logger.error(f"Exception occurred while fetching transaction details for hash {transaction_hash}: {e}")
return None
def add_financial_columns(erc1155_df, erc20_df, wallet_id, market_lookup):
"""
Merge the ERC-1155 and ERC-20 dataframes, calculate financial columns,
including whether a trade was won or lost, and fetch the latest price for each contract and tokenID.
"""
# Merge the two dataframes on the 'hash' column
merged_df = pd.merge(erc1155_df, erc20_df, how='outer', on='hash', suffixes=('_erc1155', '_erc20'))
# Convert wallet ID and columns to lowercase for case-insensitive comparison
wallet_id = wallet_id.lower()
merged_df['to_erc1155'] = merged_df['to_erc1155'].astype(str).str.lower()
merged_df['from_erc1155'] = merged_df['from_erc1155'].astype(str).str.lower()
# Remove rows where 'tokenID' is NaN or 'nan'
merged_df['tokenID'] = merged_df['tokenID'].astype(str)
merged_df = merged_df[~merged_df['tokenID'].isnull() & (merged_df['tokenID'] != 'nan')]
# Set transaction type based on wallet address
merged_df['transaction_type'] = 'other'
merged_df.loc[merged_df['to_erc1155'] == wallet_id, 'transaction_type'] = 'buy'
merged_df.loc[merged_df['from_erc1155'] == wallet_id, 'transaction_type'] = 'sell'
# Calculate the purchase price per token and total dollar value
if 'value' in merged_df.columns and 'tokenValue' in merged_df.columns:
merged_df['price_paid_per_token'] = merged_df['value'].astype(float) / merged_df['tokenValue'].astype(float)
merged_df['total_purchase_value'] = merged_df['value'].astype(float) / 10**6 # USDC has 6 decimal places
merged_df['shares'] = merged_df['total_purchase_value'] / merged_df['price_paid_per_token']
else:
logger.error("The necessary columns for calculating purchase price are missing.")
return merged_df
# Create the 'lost' and 'won' columns
merged_df['lost'] = (
(merged_df['to_erc1155'] == '0x0000000000000000000000000000000000000000') &
(merged_df['transaction_type'] == 'sell') &
(merged_df['price_paid_per_token'].isna() | (merged_df['price_paid_per_token'] == 0))
).astype(int)
merged_df['won'] = (
(merged_df['transaction_type'] == 'sell') &
(merged_df['price_paid_per_token'] == 1)
).astype(int)
merged_df.loc[merged_df['lost'] == 1, 'shares'] = 0
merged_df.loc[merged_df['lost'] == 1, 'total_purchase_value'] = 0
# Fetch live prices and calculate profit/loss (pl)
merged_df['tokenID'] = merged_df['tokenID'].astype(str)
merged_df = update_latest_prices(merged_df, market_lookup)
return merged_df
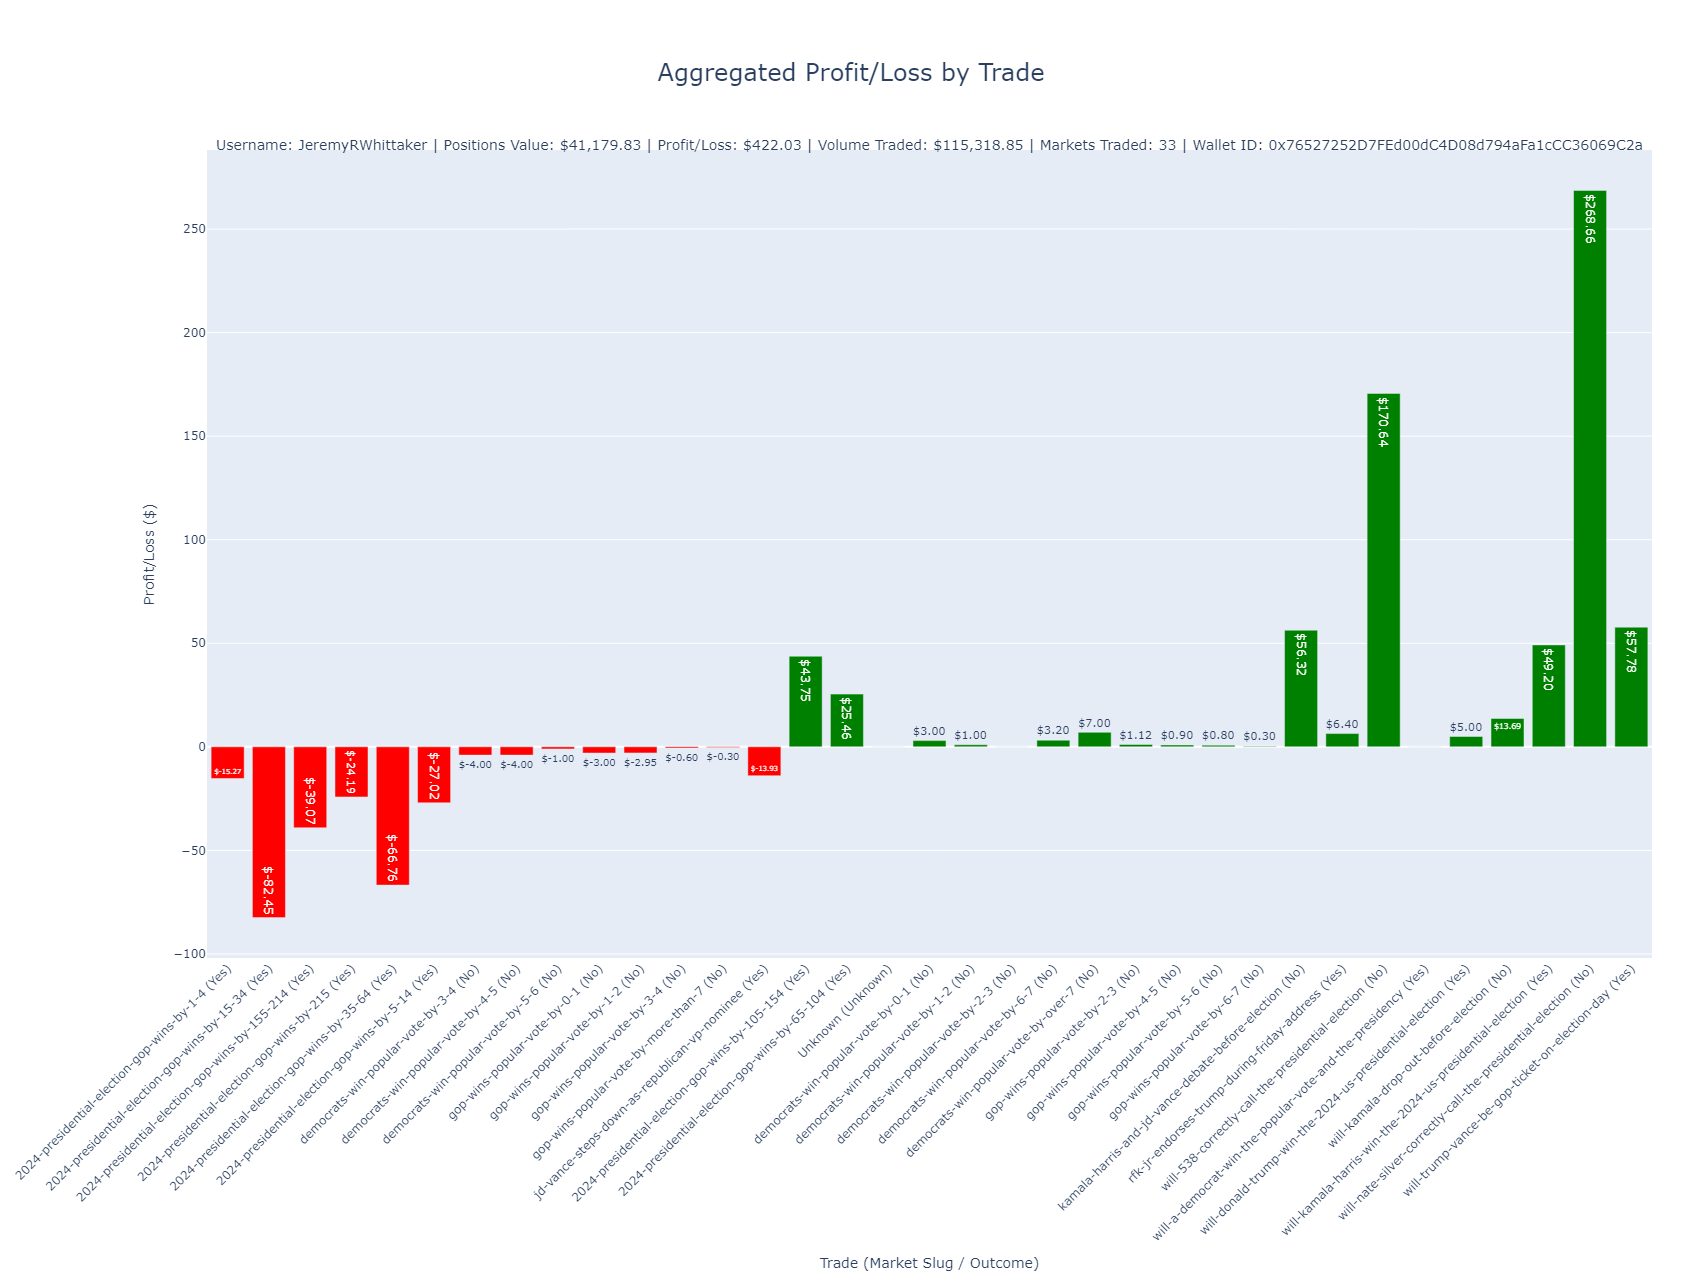
def plot_profit_loss_by_trade(df, user_info):
"""
Create a bar plot to visualize aggregated Profit/Loss (PL) by trade, with values rounded to two decimal places and formatted as currency.
Args:
df (DataFrame): DataFrame containing trade data, including 'market_slug', 'outcome', and 'pl'.
user_info (dict): Dictionary containing user information, such as username, wallet address, and other relevant details.
"""
if 'pl' not in df.columns or df['pl'].isnull().all():
logger.warning("No PL data available for plotting. Skipping plot.")
return
username = user_info.get("username", "Unknown User")
wallet_id = user_info.get("wallet_address", "N/A")
positions_value = user_info.get("positions_value", "N/A")
profit_loss = user_info.get("profit_loss", "N/A")
volume_traded = user_info.get("volume_traded", "N/A")
markets_traded = user_info.get("markets_traded", "N/A")
# Combine market_slug and outcome to create a trade identifier
df['trade'] = df['market_slug'] + ' (' + df['outcome'] + ')'
# Aggregate the Profit/Loss (pl) for each unique trade
aggregated_df = df.groupby('trade', as_index=False).agg({'pl': 'sum'})
# Round PL values to two decimal places
aggregated_df['pl'] = aggregated_df['pl'].round(2)
# Format the PL values with a dollar sign for display
aggregated_df['pl_display'] = aggregated_df['pl'].apply(lambda x: f"${x:,.2f}")
# Define a color mapping based on Profit/Loss sign
aggregated_df['color'] = aggregated_df['pl'].apply(lambda x: 'green' if x >= 0 else 'red')
# Create the plot without using the color axis
fig = px.bar(
aggregated_df,
x='trade',
y='pl',
title='',
labels={'pl': 'Profit/Loss ($)', 'trade': 'Trade (Market Slug / Outcome)'},
text='pl_display',
color='color', # Use the color column
color_discrete_map={'green': 'green', 'red': 'red'},
)
# Remove the legend if you don't want it
fig.update_layout(showlegend=False)
# Rotate x-axis labels for better readability and set the main title
fig.update_layout(
title={
'text': 'Aggregated Profit/Loss by Trade',
'y': 0.95,
'x': 0.5,
'xanchor': 'center',
'yanchor': 'top',
'font': {'size': 24}
},
xaxis_tickangle=-45,
margin=dict(t=150, l=50, r=50, b=100)
)
# Prepare the subtitle text with user information
subtitle_text = (
f"Username: {username} | Positions Value: {positions_value} | "
f"Profit/Loss: {profit_loss} | Volume Traded: {volume_traded} | "
f"Markets Traded: {markets_traded} | Wallet ID: {wallet_id}"
)
# Add the subtitle as an annotation
fig.add_annotation(
text=subtitle_text,
xref="paper",
yref="paper",
x=0.5,
y=1.02,
xanchor='center',
yanchor='top',
showarrow=False,
font=dict(size=14)
)
# Save the plot
plot_dir = "./plots/user_trades"
os.makedirs(plot_dir, exist_ok=True)
sanitized_username = sanitize_filename(username)
plot_file = os.path.join(plot_dir, f"{sanitized_username}_aggregated_profit_loss_by_trade.html")
fig.write_html(plot_file)
logger.info(f"Aggregated Profit/Loss by trade plot saved to {plot_file}")
def plot_shares_over_time(df, user_info):
"""
Create a line plot to visualize the cumulative number of shares for each token over time.
Buy orders add to the position, and sell orders subtract from it.
Args:
df (DataFrame): DataFrame containing trade data, including 'timeStamp_erc1155', 'shares', 'market_slug', 'outcome', and 'transaction_type' ('buy' or 'sell').
user_info (dict): Dictionary containing user information, such as username, wallet address, and other relevant details.
"""
if 'shares' not in df.columns or df['shares'].isnull().all():
logger.warning("No 'shares' data available for plotting. Skipping plot.")
return
username = user_info.get("username", "Unknown User")
# Ensure 'timeStamp_erc1155' is a datetime type, just in case it needs to be converted
if df['timeStamp_erc1155'].dtype != 'datetime64[ns]':
df['timeStamp_erc1155'] = pd.to_datetime(df['timeStamp_erc1155'], errors='coerce')
# Drop rows with NaN values in 'timeStamp_erc1155', 'shares', 'market_slug', 'outcome', or 'transaction_type'
df = df.dropna(subset=['timeStamp_erc1155', 'shares', 'market_slug', 'outcome', 'transaction_type'])
# Sort the dataframe by time to ensure the line chart shows the data in chronological order
df = df.sort_values(by='timeStamp_erc1155')
# Combine 'market_slug' and 'outcome' to create a unique label for each token
df['token_label'] = df['market_slug'] + " - " + df['outcome']
# Create a column for 'position_change' which adds shares for buys and subtracts shares for sells based on 'transaction_type'
df['position_change'] = df.apply(lambda row: row['shares'] if row['transaction_type'] == 'buy' else -row['shares'], axis=1)
# Group by 'token_label' and calculate the cumulative position
df['cumulative_position'] = df.groupby('token_label')['position_change'].cumsum()
# Forward fill the cumulative position to maintain it between trades
df['cumulative_position'] = df.groupby('token_label')['cumulative_position'].ffill()
# Create the line plot, grouping by 'token_label' for separate lines per token ID
fig = px.line(
df,
x='timeStamp_erc1155',
y='cumulative_position',
color='token_label', # This ensures each token ID (market_slug + outcome) gets its own line
title=f'Cumulative Shares Over Time for {username}',
labels={'timeStamp_erc1155': 'Trade Time', 'cumulative_position': 'Cumulative Position', 'token_label': 'Token (Market Slug - Outcome)'},
line_shape='linear'
)
# Update layout for better aesthetics
fig.update_layout(
title={
'text': f"Cumulative Number of Shares Over Time for {username}",
'y': 0.95,
'x': 0.5,
'xanchor': 'center',
'yanchor': 'top',
'font': {'size': 20}
},
margin=dict(t=60),
xaxis_title="Trade Time",
yaxis_title="Cumulative Number of Shares",
legend_title="Token (Market Slug - Outcome)"
)
# Save the plot
plot_dir = "./plots/user_trades"
os.makedirs(plot_dir, exist_ok=True)
sanitized_username = sanitize_filename(username)
plot_file = os.path.join(plot_dir, f"{sanitized_username}_shares_over_time.html")
fig.write_html(plot_file)
logger.info(f"Cumulative shares over time plot saved to {plot_file}")
def plot_user_trades(df, user_info):
"""Plot user trades and save plots, adjusting for trades that were lost."""
username = user_info["username"]
wallet_id = user_info["wallet_address"]
# Sanitize only the filename, not the directory
sanitized_username = sanitize_filename(username)
info_text = (
f"Username: {username} | Positions Value: {user_info['positions_value']} | "
f"Profit/Loss: {user_info['profit_loss']} | Volume Traded: {user_info['volume_traded']} | "
f"Markets Traded: {user_info['markets_traded']} | Wallet ID: {wallet_id}"
)
# Ensure the directory exists
os.makedirs("./plots/user_trades", exist_ok=True)
plot_dir = "./plots/user_trades"
# Flag loss trades where to_erc1155 is zero address, transaction_type is sell, and price_paid_per_token is NaN
df['is_loss'] = df.apply(
lambda row: (row['to_erc1155'] == '0x0000000000000000000000000000000000000000')
and (row['transaction_type'] == 'sell')
and pd.isna(row['price_paid_per_token']), axis=1)
# Set shares and total purchase value to zero for loss trades
df.loc[df['is_loss'], 'shares'] = 0
df.loc[df['is_loss'], 'total_purchase_value'] = 0
### Modify for Total Purchase Value by Market (Current holdings)
df['total_purchase_value_adjusted'] = df.apply(
lambda row: row['total_purchase_value'] if row['transaction_type'] == 'buy' else -row['total_purchase_value'],
axis=1
)
grouped_df_value = df.groupby(['market_slug']).agg({
'total_purchase_value_adjusted': 'sum',
'shares': 'sum',
}).reset_index()
# Calculate the weighted average price_paid_per_token
grouped_df_value['weighted_price_paid_per_token'] = (
grouped_df_value['total_purchase_value_adjusted'] / grouped_df_value['shares']
)
# Sort by total_purchase_value in descending order (ignoring outcome)
grouped_df_value = grouped_df_value.sort_values(by='total_purchase_value_adjusted', ascending=False)
# Format the label for the bars (removing outcome)
grouped_df_value['bar_label'] = (
"Avg Price: $" + grouped_df_value['weighted_price_paid_per_token'].round(2).astype(str)
)
fig = px.bar(
grouped_df_value,
x='market_slug',
y='total_purchase_value_adjusted',
barmode='group',
title=f"Current Total Purchase Value by Market for {username}",
labels={'total_purchase_value_adjusted': 'Current Total Purchase Value', 'market_slug': 'Market'},
text=grouped_df_value['bar_label'],
hover_data={'weighted_price_paid_per_token': ':.2f'},
)
fig.update_layout(
title={
'text': f"Current Total Purchase Value by Market for {username}",
'y': 0.95,
'x': 0.5,
'xanchor': 'center',
'yanchor': 'top',
'font': {'size': 20}
},
margin=dict(t=60),
showlegend=False # Remove the legend as you requested
)
fig.add_annotation(
text=info_text,
xref="paper", yref="paper", showarrow=False, x=0.5, y=1.05, font=dict(size=12)
)
# Save the bar plot as an HTML file
plot_file = os.path.join(plot_dir, f"{sanitized_username}_current_market_purchase_value.html")
fig.write_html(plot_file)
logger.info(f"Current market purchase value plot saved to {plot_file}")
### Modify for Trade Quantity by Market (Current holdings)
df['shares_adjusted'] = df.apply(
lambda row: row['shares'] if row['transaction_type'] == 'buy' else -row['shares'], axis=1)
grouped_df_quantity = df.groupby(['market_slug']).agg({
'shares_adjusted': 'sum',
'total_purchase_value': 'sum',
}).reset_index()
# Calculate the weighted average price_paid_per_token
grouped_df_quantity['weighted_price_paid_per_token'] = (
grouped_df_quantity['total_purchase_value'] / grouped_df_quantity['shares_adjusted']
)
grouped_df_quantity = grouped_df_quantity.sort_values(by='shares_adjusted', ascending=False)
grouped_df_quantity['bar_label'] = (
"Quantity: " + grouped_df_quantity['shares_adjusted'].round().astype(int).astype(str) + "<br>" +
"Avg Price: $" + grouped_df_quantity['weighted_price_paid_per_token'].round(2).astype(str)
)
fig = px.bar(
grouped_df_quantity,
x='market_slug',
y='shares_adjusted',
barmode='group',
title=f"Current Trade Quantity by Market for {username}",
labels={'shares_adjusted': 'Current Trade Quantity', 'market_slug': 'Market'},
text=grouped_df_quantity['bar_label'],
)
fig.update_layout(
title={
'text': f"Current Trade Quantity by Market for {username}",
'y': 0.95,
'x': 0.5,
'xanchor': 'center',
'yanchor': 'top',
'font': {'size': 20}
},
margin=dict(t=60),
showlegend=False # Remove the legend as you requested
)
fig.add_annotation(
text=info_text,
xref="paper", yref="paper", showarrow=False, x=0.5, y=1.05, font=dict(size=12)
)
# Save the trade quantity plot as an HTML file
plot_file = os.path.join(plot_dir, f"{sanitized_username}_current_market_trade_quantity.html")
fig.write_html(plot_file)
logger.info(f"Current market trade quantity plot saved to {plot_file}")
### Modify for Total Purchase Value Timeline
df['total_purchase_value_timeline_adjusted'] = df.apply(
lambda row: row['total_purchase_value'] if row['transaction_type'] == 'buy' else -row['total_purchase_value'],
axis=1
)
# Combine 'market_slug' and 'outcome' into a unique label
df['market_outcome_label'] = df['market_slug'] + ' (' + df['outcome'] + ')'
# Create the scatter plot, now coloring by 'market_outcome_label'
fig = px.scatter(
df,
x='timeStamp_erc1155',
y='total_purchase_value_timeline_adjusted',
color='market_outcome_label', # Use the combined label for market and outcome
title=f"Total Purchase Value Timeline for {username}",
labels={
'total_purchase_value_timeline_adjusted': 'Total Purchase Value',
'timeStamp_erc1155': 'Transaction Time',
'market_outcome_label': 'Market/Outcome'
},
hover_data=['market_slug', 'price_paid_per_token', 'outcome', 'hash'],
)
fig.update_layout(
title={
'text': f"Total Purchase Value Timeline for {username}",
'y': 0.95,
'x': 0.5,
'xanchor': 'center',
'yanchor': 'top',
'font': {'size': 20}
},
margin=dict(t=60)
)
fig.add_annotation(
text=info_text,
xref="paper", yref="paper", showarrow=False, x=0.5, y=1.05, font=dict(size=12)
)
# Save the updated plot
plot_file = os.path.join(plot_dir, f"{sanitized_username}_total_purchase_value_timeline_adjusted.html")
fig.write_html(plot_file)
logger.info(f"Total purchase value timeline plot saved to {plot_file}")
def plot_total_purchase_value(df, user_info):
"""Create and save a scatter plot for total purchase value, accounting for buy and sell transactions."""
# Ensure the directory exists
os.makedirs("./plots/user_trades", exist_ok=True)
plot_dir = "./plots/user_trades"
username = user_info["username"]
wallet_id = user_info["wallet_address"]
# Sanitize only the filename, not the directory
sanitized_username = sanitize_filename(username)
info_text = (
f"Username: {username} | Positions Value: {user_info['positions_value']} | "
f"Profit/Loss: {user_info['profit_loss']} | Volume Traded: {user_info['volume_traded']} | "
f"Markets Traded: {user_info['markets_traded']} | Wallet ID: {wallet_id}"
)
# Flag loss trades where to_erc1155 is zero address, transaction_type is sell, and price_paid_per_token is NaN
df['is_loss'] = df.apply(
lambda row: (row['to_erc1155'] == '0x0000000000000000000000000000000000000000')
and (row['transaction_type'] == 'sell')
and pd.isna(row['price_paid_per_token']), axis=1)
# Set shares and total purchase value to zero for loss trades
df.loc[df['is_loss'], 'shares'] = 0
df.loc[df['is_loss'], 'total_purchase_value'] = 0
# Adjust the total purchase value based on the transaction type
df['total_purchase_value_adjusted'] = df.apply(
lambda row: row['total_purchase_value'] if row['transaction_type'] == 'buy' else -row['total_purchase_value'],
axis=1
)
# Create the scatter plot for total purchase value over time
fig = px.scatter(
df,
x='timeStamp_erc1155', # Assuming this is the correct timestamp field
y='total_purchase_value_adjusted', # Adjusted values for buys and sells
color='market_slug', # Use market_slug with outcome as the color
title=f"Current Purchase Value Timeline for {username}", # Update title to reflect "current"
labels={'total_purchase_value_adjusted': 'Adjusted Purchase Value ($)', 'timeStamp_erc1155': 'Transaction Time'},
hover_data=['market_slug', 'price_paid_per_token', 'outcome', 'hash'],
)
# Adjust title positioning and font size
fig.update_layout(
title={
'text': f"Current Purchase Value Timeline for {username}", # Update to "Current"
'y': 0.95,
'x': 0.5,
'xanchor': 'center',
'yanchor': 'top',
'font': {'size': 20}
},
margin=dict(t=60)
)
fig.add_annotation(
text=info_text,
xref="paper", yref="paper", showarrow=False, x=0.5, y=1.05, font=dict(size=12)
)
# Save the scatter plot as an HTML file
plot_file = os.path.join(plot_dir, f"{sanitized_username}_current_purchase_value_timeline.html")
fig.write_html(plot_file)
logger.info(f"Current purchase value timeline plot saved to {plot_file}")
def create_and_save_pie_chart(df, user_info):
"""Create and save a pie chart for user's current holdings."""
# Ensure the directory exists
os.makedirs("./plots/user_trades", exist_ok=True)
plot_dir = "./plots/user_trades"
username = user_info["username"]
wallet_id = user_info["wallet_address"]
sanitized_username = sanitize_filename(username)
info_text = (
f"Username: {username} | Positions Value: {user_info['positions_value']} | "
f"Profit/Loss: {user_info['profit_loss']} | Volume Traded: {user_info['volume_traded']} | "
f"Markets Traded: {user_info['markets_traded']} | Wallet ID: {wallet_id}"
)
# Flag loss trades where to_erc1155 is zero address, transaction_type is sell, and price_paid_per_token is NaN
df['is_loss'] = df.apply(
lambda row: (row['to_erc1155'] == '0x0000000000000000000000000000000000000000')
and (row['transaction_type'] == 'sell')
and pd.isna(row['price_paid_per_token']), axis=1)
# Set shares and total purchase value to zero for loss trades
df.loc[df['is_loss'], 'shares'] = 0
df['shares_adjusted'] = df.apply(
lambda row: row['shares'] if row['transaction_type'] == 'buy' else -row['shares'], axis=1)
holdings = df.groupby('market_slug').agg({'shares_adjusted': 'sum'}).reset_index()
holdings = holdings.sort_values('shares_adjusted', ascending=False)
threshold = 0.02
large_slices = holdings[holdings['shares_adjusted'] > holdings['shares_adjusted'].sum() * threshold]
small_slices = holdings[holdings['shares_adjusted'] <= holdings['shares_adjusted'].sum() * threshold]
if not small_slices.empty:
other_sum = small_slices['shares_adjusted'].sum()
others_df = pd.DataFrame([{'market_slug': 'Others', 'shares_adjusted': other_sum}])
large_slices = pd.concat([large_slices, others_df], ignore_index=True)
fig = px.pie(
large_slices,
names='market_slug',
values='shares_adjusted',
title=f"Current Holdings Distribution by Market for {username}",
)
fig.update_layout(
title={
'text': f"Current Holdings Distribution by Market for {username}",
'y': 0.95,
'x': 0.5,
'xanchor': 'center',
'yanchor': 'top',
'font': {'size': 20}
},
margin=dict(t=60)
)
fig.add_annotation(
text=info_text,
xref="paper", yref="paper", showarrow=False, x=0.5, y=1.05, font=dict(size=12)
)
# Save the pie chart as an HTML file
plot_file = os.path.join(plot_dir, f"{sanitized_username}_current_holdings_pie_chart.html")
fig.write_html(plot_file)
logger.info(f"Current holdings pie chart saved to {plot_file}")
def create_and_save_treemap(df, user_info):
"""Create and save a treemap for user's current holdings."""
plot_dir = './plots/user_trades'
username = user_info["username"]
wallet_id = user_info["wallet_address"]
sanitized_username = sanitize_filename(username)
info_text = (
f"Username: {username} | Positions Value: {user_info['positions_value']} | "
f"Profit/Loss: {user_info['profit_loss']} | Volume Traded: {user_info['volume_traded']} | "
f"Markets Traded: {user_info['markets_traded']} | Wallet ID: {wallet_id}"
)
# Flag loss trades where to_erc1155 is zero address, transaction_type is sell, and price_paid_per_token is NaN
df['is_loss'] = df.apply(
lambda row: (row['to_erc1155'] == '0x0000000000000000000000000000000000000000')
and (row['transaction_type'] == 'sell')
and pd.isna(row['price_paid_per_token']), axis=1)
# Set shares and total purchase value to zero for loss trades
df.loc[df['is_loss'], 'shares'] = 0
# Adjust shares based on transaction type (buy vs sell)
df['shares_adjusted'] = df.apply(
lambda row: row['shares'] if row['transaction_type'] == 'buy' else -row['shares'], axis=1)
# Group by market_slug and outcome for treemap
holdings = df.groupby(['market_slug', 'outcome']).agg({'shares_adjusted': 'sum'}).reset_index()
# Create the treemap
fig = px.treemap(
holdings,
path=['market_slug', 'outcome'],
values='shares_adjusted',
title=f"Current Holdings Distribution by Market and Outcome for {username}",
)
# Adjust title positioning and font size
fig.update_layout(
title={
'text': f"Current Holdings Distribution by Market and Outcome for {username}",
'y': 0.95,
'x': 0.5,
'xanchor': 'center',
'yanchor': 'top',
'font': {'size': 20}
},
margin=dict(t=60)
)
fig.add_annotation(
text=info_text,
xref="paper", yref="paper", showarrow=False, x=0.5, y=1.05, font=dict(size=12)
)
# Save the treemap as an HTML file
plot_file = os.path.join(plot_dir, f"{sanitized_username}_current_holdings_treemap.html")
fig.write_html(plot_file)
logger.info(f"Current holdings treemap saved to {plot_file}")
def update_latest_prices(merged_df, market_lookup):
"""
Fetch and update the latest prices for each contract and tokenID pair in the merged_df,
and calculate profit/loss (pl) based on the live price.
"""
# Ensure 'pl' column exists in the DataFrame
if 'pl' not in merged_df.columns:
merged_df['pl'] = np.nan # Import numpy as np at the top of your script
# Ensure tokenID is a string and filter out NaN tokenIDs
merged_df['tokenID'] = merged_df['tokenID'].astype(str)
merged_df = merged_df[~merged_df['tokenID'].isnull() & (merged_df['tokenID'] != 'nan')]
unique_contract_token_pairs = merged_df[['contractAddress_erc1155', 'tokenID']].drop_duplicates()
for contract_address, token_id in unique_contract_token_pairs.itertuples(index=False):
# Ensure token_id is a string
token_id_str = str(token_id)
if not token_id_str or token_id_str == 'nan':
logger.warning("Encountered NaN or empty token_id. Skipping.")
continue
# Find market_slug and outcome using the market_lookup
market_slug, outcome = find_market_info(token_id_str, market_lookup)
if market_slug and outcome:
# Update live price and pl in the DataFrame
merged_df = update_live_price_and_pl(merged_df, token_id_str, market_slug=market_slug, outcome=outcome)
else:
logger.warning(f"Market info not found for token ID: {token_id_str}. Skipping PL calculation for these rows.")
# Optionally, set 'pl' to 0 or np.nan for these rows
merged_df.loc[merged_df['tokenID'] == token_id_str, 'pl'] = np.nan
return merged_df
def call_get_user_profile(wallet_id):
"""
Call subprocess to get user profile data by wallet_id.
"""
if not wallet_id:
logger.error("No wallet ID provided.")
return None
try:
logger.info(f"Calling subprocess to fetch user profile for wallet ID: {wallet_id}")
# Execute get_user_profile.py using subprocess and pass wallet_id
result = subprocess.run(
['python3', 'get_user_profile.py', wallet_id], # Make sure wallet_id is passed as an argument
stdout=subprocess.PIPE,
stderr=subprocess.PIPE,
check=True,
text=True,
timeout=30 # Set a timeout for the subprocess
)
logger.debug(f"Subprocess stdout: {result.stdout}")
logger.debug(f"Subprocess stderr: {result.stderr}")
# Parse the JSON response from stdout
user_data = json.loads(result.stdout)
return user_data
except subprocess.TimeoutExpired:
logger.error(f"Subprocess timed out when fetching user profile for wallet ID: {wallet_id}")
return None
except subprocess.CalledProcessError as e:
logger.error(f"Subprocess error when fetching user profile for wallet ID {wallet_id}: {e.stderr}")
return None
except json.JSONDecodeError as e:
logger.error(f"Failed to parse JSON from subprocess for wallet ID {wallet_id}: {e}")
return None
def replace_hex_values(df, columns):
"""
Replace specific hex values in the given columns with their corresponding names.
Args:
- df (pd.DataFrame): The DataFrame containing the transaction data.
- columns (list): List of column names where the hex values should be replaced.
Returns:
- pd.DataFrame: The DataFrame with the replaced values.
"""
# Mapping of hex values to their corresponding names
replacement_dict = {
'0x2791Bca1f2de4661ED88A30C99A7a9449Aa84174': 'CTF_EXCHANGE',
'0x4d97dcd97ec945f40cf65f87097ace5ea0476045': 'NEG_RISK_CTF_EXCHANGE',
'0xC5d563A36AE78145C45a50134d48A1215220f80a': 'NEG_RISK_CTF_EXCHANGE_SPENDER',
'0xd91E80cF2E7be2e162c6513ceD06f1dD0dA35296': 'NEG_RISK_ADAPTER',
'0x4bFb41d5B3570DeFd03C39a9A4D8dE6Bd8B8982E': 'CTF_EXCHANGE_SPENDER',
}
for column in columns:
if column in df.columns:
df[column] = df[column].replace(replacement_dict)
return df
def process_wallet_data(wallet_addresses, api_key, plot=True, latest_price_mode=False):
"""
Processes user wallet data to generate user transaction information. If `latest_price_mode` is set to True,
the function will only retrieve the latest prices for tokens without generating user reports.
Args:
- wallet_addresses (list): List of wallet addresses to process.
- api_key (str): The Polygonscan API key.
- plot (bool): Whether to generate plots for the user data.
- latest_price_mode (bool): If True, only retrieve the latest transaction prices for the given wallets.
"""
# Load environment variables
load_dotenv("keys.env")
# Ensure the output directory exists
output_dir = './data/user_trades/'
os.makedirs(output_dir, exist_ok=True)
# Load the market lookup JSON data
market_lookup_path = './data/market_lookup.json'
market_lookup = load_market_lookup(market_lookup_path)
for wallet_address in wallet_addresses:
# Fetch user info (username) based on wallet ID
user_info = call_get_user_profile(wallet_address) # Pass wallet_address to the function
username = user_info['username'] if user_info else "Unknown"
# Sanitize the username to create a valid filename
sanitized_username = sanitize_filename(username)
logger.info(f"Processing wallet for user: {username}")
# API URLs for ERC-20 and ERC-1155 transactions
erc20_url = f"https://api.polygonscan.com/api?module=account&action=tokentx&address={wallet_address}&startblock=0&endblock=99999999&sort=asc&apikey={api_key}"
erc1155_url = f"https://api.polygonscan.com/api?module=account&action=token1155tx&address={wallet_address}&startblock=0&endblock=99999999&sort=asc&apikey={api_key}"
# Fetch ERC-20 and ERC-1155 transactions
erc20_response = fetch_data(erc20_url)
erc1155_response = fetch_data(erc1155_url)
if erc20_response['status'] == '1' and erc1155_response['status'] == '1':
erc20_data = erc20_response['result']
erc1155_data = erc1155_response['result']
# Convert data to DataFrames
erc20_df = pd.DataFrame(erc20_data)
erc1155_df = pd.DataFrame(erc1155_data)
# Enrich ERC-1155 data with market_slug and outcome
erc1155_df = enrich_erc1155_data(erc1155_df, market_lookup)
# Add timestamps
erc1155_df, erc20_df = add_timestamps(erc1155_df, erc20_df)
# Merge and add financial columns
merged_df = add_financial_columns(erc1155_df, erc20_df, wallet_address, market_lookup)
if 'pl' in merged_df.columns:
logger.info(f"'pl' column exists with {merged_df['pl'].count()} non-null values.")
else:
logger.error("'pl' column does not exist in merged_df after update_latest_prices.")
# Replace hex values with the corresponding names
columns_to_replace = ['contractAddress_erc1155', 'from_erc1155', 'to_erc1155']
merged_df = replace_hex_values(merged_df, columns_to_replace)
# Save the merged and enriched data
output_file = f'{output_dir}{sanitized_username}_enriched_transactions.csv'
merged_df.to_csv(output_file, index=False)
logger.info(f"Enriched data saved to {output_file}")
# Check if 'pl' column exists and has non-null values
if 'pl' in merged_df.columns and merged_df['pl'].notnull().any():
logger.info(f"'pl' column exists with {merged_df['pl'].count()} non-null values.")
if not latest_price_mode:
# Generate and save the Profit/Loss by trade plot
plot_profit_loss_by_trade(merged_df, user_info)
else:
logger.warning(f"'pl' column is missing or empty for user {username}. Skipping PL plot.")
logger.info("Data processing completed.")
def call_scrape_wallet_ids(top_volume=True, top_profit=True):
"""
Scrape leaderboard and return wallet IDs based on top volume or top profit.
Args:
- top_volume (bool): Whether to fetch top volume users.
- top_profit (bool): Whether to fetch top profit users.
Returns:
- List of wallet IDs.
"""
wallet_ids = []
# Construct the command to call get_leaderboard_wallet_ids.py with appropriate flags
command = ['python3', 'get_leaderboard_wallet_ids.py']
if top_volume:
command.append('--top-volume')
if top_profit:
command.append('--top-profit')
try:
# Run the script with the constructed command
result = subprocess.run(
command,
stdout=subprocess.PIPE,
stderr=subprocess.PIPE,
check=True,
text=True
)
logger.debug(f"Leaderboard wallet script stdout: {result.stdout}")
# Parse the output as JSON and extend the wallet_ids list
wallet_ids.extend(json.loads(result.stdout))
except subprocess.CalledProcessError as e:
logger.error(f"Error running get_leaderboard_wallet_ids.py: {e.stderr}")
except json.JSONDecodeError as json_err:
logger.error(f"Failed to parse JSON from get_leaderboard_wallet_ids.py: {json_err}")
# Log the combined wallet IDs
logger.info(f"Fetched {len(wallet_ids)} wallet IDs based on volume/profit flags.")
return wallet_ids
def process_and_plot_user_data(wallet_addresses, api_key, plot=True, latest_price_mode=False):
"""
Process wallet data for each user, calculate financial data, and optionally generate plots.
Args:
wallet_addresses (list): List of wallet addresses.
api_key (str): Polygonscan API key.
plot (bool): Whether to generate plots for the user data.
latest_price_mode (bool): If True, only retrieve the latest prices, no plotting.
"""
# Load market lookup data
market_lookup_path = './data/market_lookup.json'
market_lookup = load_market_lookup(market_lookup_path)
# Define the columns to keep
columns_to_keep = [
'timeStamp_erc1155', 'tokenID', 'tokenValue', 'market_slug', 'outcome',
'value', 'tokenDecimal', 'transaction_type', 'price_paid_per_token',
'total_purchase_value', 'shares', 'lost', 'won', 'pl', 'live_price'
]
for wallet_address in wallet_addresses:
# Fetch user info (username) based on wallet ID
user_info = call_get_user_profile(wallet_address)
username = user_info.get('username', "Unknown")
logger.info(f"Processing wallet for user: {username} ({wallet_address})")
# Fetch ERC-20 and ERC-1155 transactions
erc20_df, erc1155_df = fetch_user_transactions(wallet_address, api_key)
if erc20_df is not None and erc1155_df is not None:
# Enrich ERC-1155 data with market_slug and outcome
erc1155_df = enrich_erc1155_data(erc1155_df, market_lookup)
# Add timestamps
erc1155_df, erc20_df = add_timestamps(erc1155_df, erc20_df)
# Merge and add financial columns
merged_df = add_financial_columns(erc1155_df, erc20_df, wallet_address, market_lookup)
# Check for Profit/Loss data
if 'pl' in merged_df.columns and merged_df['pl'].notnull().any():
if not latest_price_mode and plot:
# Generate all plots for the user
generate_all_user_plots(merged_df, user_info)
# Save the merged and enriched data
sanitized_username = sanitize_filename(username)
output_dir = './data/user_trades/'
os.makedirs(output_dir, exist_ok=True)
# Save to Parquet (default format)
output_file_parquet = f'{output_dir}{sanitized_username}_enriched_transactions.parquet'
merged_df.to_parquet(output_file_parquet, index=False)
logger.info(f"Enriched data saved to {output_file_parquet}")
# Save to CSV
# Keep only the specified columns and sort by timeStamp_erc1155
merged_df = merged_df[columns_to_keep].sort_values(by='timeStamp_erc1155', ascending=True)
output_file_csv = f'{output_dir}{sanitized_username}_enriched_transactions.csv'
merged_df.to_csv(output_file_csv, index=False)
logger.info(f"Enriched data saved to {output_file_csv}")
else:
logger.warning(f"Profit/Loss column missing or empty for user: {username}")
else:
logger.error(f"Failed to fetch transaction data for wallet: {wallet_address}")
def generate_all_user_plots(merged_df, user_info):
"""
Generate all necessary plots for a user.
Args:
merged_df (DataFrame): The merged DataFrame with user transactions and financial info.
user_info (dict): Dictionary containing user information.
"""
# Generate Profit/Loss by Trade plot
plot_profit_loss_by_trade(merged_df, user_info)
# Generate Shares Over Time plot
plot_shares_over_time(merged_df, user_info)
# Generate Total Purchase Value by Market plot
plot_user_trades(merged_df, user_info)
# Generate Pie Chart for Holdings
create_and_save_pie_chart(merged_df, user_info)
# Generate Treemap for Holdings
create_and_save_treemap(merged_df, user_info)
logger.info(f"All plots generated for user: {user_info['username']}")
def fetch_user_transactions(wallet_address, api_key):
"""
Fetch ERC-20 and ERC-1155 transaction data for a user with pagination.
Args:
wallet_address (str): Wallet address to fetch transactions for.
api_key (str): Polygonscan API key.
Returns:
(DataFrame, DataFrame): DataFrames for ERC-20 and ERC-1155 transactions.
"""
def fetch_paginated_data(url):
"""
Fetch paginated data from the provided URL.
Args:
url (str): Base URL for the API request.
Returns:
DataFrame: DataFrame with all paginated results.
"""
page = 1
offset = 1000 # Set the offset/page size based on the API's limits (e.g., 1000)
all_data = []
while True:
paginated_url = f"{url}&page={page}&offset={offset}"
data = fetch_data(paginated_url)
if data and data['status'] == '1' and len(data['result']) > 0:
all_data.extend(data['result'])
page += 1
else:
break # Stop if no more data is returned
return pd.DataFrame(all_data)
# Fetch ERC-20 transactions with pagination
erc20_url = (f"https://api.polygonscan.com/api"
f"?module=account"
f"&action=tokentx"
f"&address={wallet_address}"
f"&startblock=0"
f"&endblock=99999999"
f"&sort=desc"
f"&apikey={api_key}")
erc20_df = fetch_paginated_data(erc20_url)
# Fetch ERC-1155 transactions with pagination
erc1155_url = (f"https://api.polygonscan.com/api"
f"?module=account"
f"&action=token1155tx"
f"&address={wallet_address}"
f"&startblock=0"
f"&endblock=99999999"
f"&sort=desc"
f"&apikey={api_key}")
erc1155_df = fetch_paginated_data(erc1155_url)
if not erc20_df.empty and not erc1155_df.empty:
return erc20_df, erc1155_df
else:
return None, None
def fetch_wallet_addresses(skip_leaderboard, top_volume, top_profit):
"""
Fetch wallet addresses based on leaderboard data or manual input.
Args:
skip_leaderboard (bool): Whether to skip leaderboard fetching.
top_volume (bool): Fetch top volume users.
top_profit (bool): Fetch top profit users.
Returns:
list: A list of wallet addresses to process.
"""
# Manually specified wallet addresses
manual_wallet_ids = [
'0x76527252D7FEd00dC4D08d794aFa1cCC36069C2a',
# Add more wallet IDs as needed
]
if not skip_leaderboard:
leaderboard_wallet_ids = call_scrape_wallet_ids(top_volume=top_volume, top_profit=top_profit)
wallet_addresses = list(set(manual_wallet_ids + leaderboard_wallet_ids)) # Remove duplicates
else:
wallet_addresses = manual_wallet_ids
return wallet_addresses
def main(wallet_addresses=None, skip_leaderboard=False, top_volume=False, top_profit=False, plot=True, latest_price_mode=False):
"""
Main function to process wallet data and generate plots.
Args:
wallet_addresses (list): A list of wallet addresses to process (if provided).
skip_leaderboard (bool): Whether to skip fetching leaderboard data.
top_volume (bool): Whether to fetch top volume users.
top_profit (bool): Whether to fetch top profit users.
plot (bool): Whether to generate plots for the user data.
latest_price_mode (bool): If True, only retrieve the latest prices, no plotting.
"""
# Load environment variables
load_dotenv("keys.env")
api_key = os.getenv('POLYGONSCAN_API_KEY')
if not wallet_addresses:
# Fetch wallet addresses if not provided
wallet_addresses = fetch_wallet_addresses(skip_leaderboard, top_volume, top_profit)
# Process wallet data and optionally generate plots
process_and_plot_user_data(wallet_addresses, api_key, plot=plot, latest_price_mode=latest_price_mode)
if __name__ == "__main__":
# Use argparse to accept command-line arguments
parser = argparse.ArgumentParser(description='Process wallet data for specific wallet addresses.')
parser.add_argument(
'--wallets',
nargs='+', # This will accept multiple wallet IDs
help='List of wallet addresses to process.'
)
parser.add_argument('--skip-leaderboard', action='store_true', help='Skip leaderboard fetching.')
parser.add_argument('--top-volume', action='store_true', help='Fetch top volume users.')
parser.add_argument('--top-profit', action='store_true', help='Fetch top profit users.')
parser.add_argument('--no-plot', action='store_true', help='Disable plot generation.')
parser.add_argument('--latest-price-mode', action='store_true',
help='Only retrieve the latest prices, no plotting.')
args = parser.parse_args()
# Call the main function with the parsed arguments
main(
wallet_addresses=args.wallets,
skip_leaderboard=args.skip_leaderboard,
top_volume=args.top_volume,
top_profit=args.top_profit,
plot=not args.no_plot,
latest_price_mode=args.latest_price_mode
)