Analysis of House Prices and Interest Rates: The Path to Equilibrium Using Python and FRED

There is always discussion surrounding the trajectory of house prices. At the core of these debates lies the principle of consumer affordability, which is heavily influenced by monthly mortgage payments. I developed a Python program that models the interaction between house prices and mortgage interest rates, utilizing historical data from the FRED (Federal Reserve Economic Data) API.

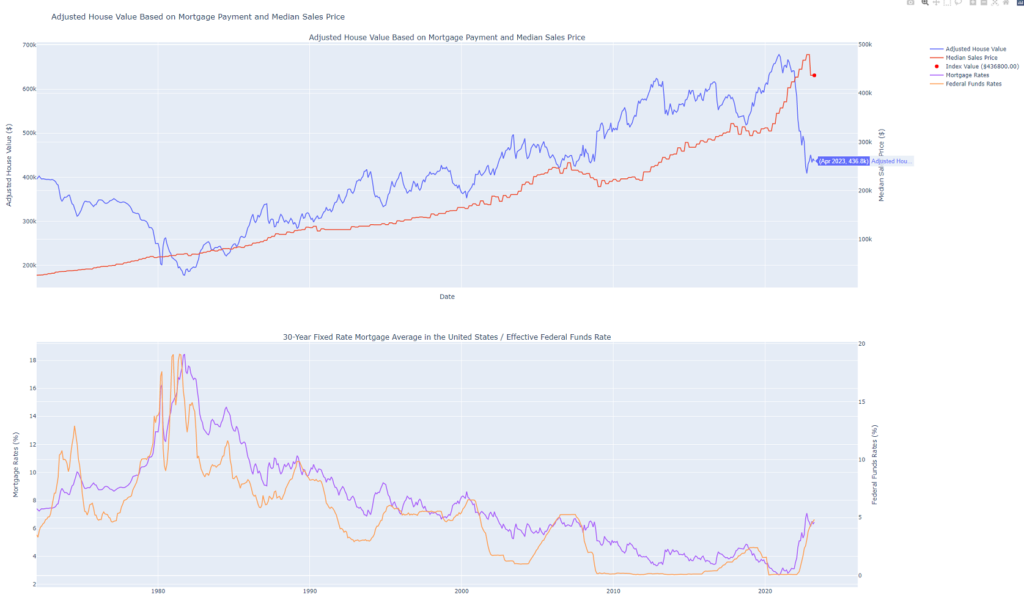
The program employs several functions to extract mortgage rates and average house price data from FRED, calculate monthly mortgage payments, and adjust house values based on interest rates. The final output is a chart illustrating the adjusted house values in relation to mortgage rates and median sales prices over time.

The Python code and the corresponding chart offer an in-depth tool for analyzing the impact of mortgage rates on house values and evaluating the sustainability of current market conditions. Based on the models the current median sales price is overvalued by ~38.4%

Code Overview:

The code is organized into several functions that fetch data from the FRED (Federal Reserve Economic Data) API, calculate monthly mortgage payments, and plot the adjusted house values. Here’s a brief overview of the main functions:

  1. get_historical_mortgage_rates(): Fetches historical mortgage rates data from FRED.
  2. calculate_monthly_mortgage(): Calculates the monthly mortgage payment for a given price, year, and month.
  3. adjusted_house_value(): Calculates the house value for other dates based on the mortgage payment amount and interest rates.
  4. get_average_house_prices(): Fetches average house prices data from FRED.
  5. adjusted_house_value_median_sales_price(): Combines the adjusted house value calculations with the median sales price data and plots the results.
import datetime
import pandas as pd
from fredapi import Fred
from config import api_key
import datetime
import numpy as np
from dateutil.relativedelta import relativedelta
import plotly.graph_objs as go
import plotly.io as pio
import plotly.subplots as sp
import plotly.offline as pyo


def get_historical_mortgage_rates(api_key, series_id, start_date=None, end_date=None):
    fred = Fred(api_key=api_key)
    mortgage_rates = fred.get_series(series_id, start_date, end_date)
    mortgage_rates = pd.DataFrame(mortgage_rates).reset_index()
    mortgage_rates.columns = ["date", "rate"]
    mortgage_rates["year_month"] = mortgage_rates["date"].apply(lambda x: x.strftime("%Y-%m"))
    mortgage_rates_dict = mortgage_rates.set_index("year_month")["rate"].to_dict()
    return mortgage_rates_dict


def calculate_monthly_mortgage(price, year, month, mortgage_rate_data):
    # Create year-month string
    year_month = f"{year}-{month:02d}"

    # Find the corresponding mortgage rate for the given year and month
    if year_month in mortgage_rate_data:
        mortgage_rate = mortgage_rate_data[year_month]
    else:
        raise ValueError(f"No mortgage rate data found for {year}-{month}")

    # Calculate the monthly interest rate
    monthly_interest_rate = (mortgage_rate / 100) / 12

    # Calculate the number of payments for a 30-year mortgage
    num_payments = 30 * 12

    # Calculate the monthly mortgage payment using the formula
    # M = P [r(1 + r)^n] / [(1 + r)^n – 1]
    monthly_payment = price * (monthly_interest_rate * (1 + monthly_interest_rate) ** num_payments) / (
                (1 + monthly_interest_rate) ** num_payments - 1)

    return monthly_payment
def adjusted_house_value(price, index_date, mortgage_rate_data):
    # Calculate the mortgage payment for the given index date
    index_year = index_date.yearY
    index_payment = calculate_monthly_mortgage(price, index_year, index_month, mortgage_rate_data)

    # Calculate the house value for other dates based on the mortgage payment amount and the interest rates
    house_values = {}
    for year_month, rate in mortgage_rate_data.items():
        year, month = map(int, year_month.split('-'))
        date = datetime.date(year, month, 1)
        house_value = index_payment * ((1 + monthly_interest_rate)**num_payments - 1) / (monthly_interest_rate * (1 + monthly_interest_rate)**num_payments)
        house_values[date] = house_value

    # Plot the house values
    dates = sorted(house_values.keys())
    values = [house_values[date] for date in dates]

    # Create the plot using Plotly
    fig = go.Figure()

    fig.add_trace(go.Scatter(x=dates, y=values, mode="lines", name="Adjusted House Value"))

    # Mark the index date and value with a vertical dot
    index_value = house_values[index_date]
    fig.add_trace(go.Scatter(x=[index_date], y=[index_value], mode="markers", marker=dict(color="red", size=8), name=f"Index Value (${index_value:.2f})"))

    fig.update_layout(title="Adjusted House Value Based on Mortgage Payment", xaxis_title="Date", yaxis_title="House Value ($)")

    # Show the plot
    pio.show(fig)
    pyo.plot(fig, filename="output.html", auto_open=False)


def get_average_house_prices(api_key, series_id, start_date=None, end_date=None):
    fred = Fred(api_key=api_key)
    average_house_prices = fred.get_series(series_id, start_date, end_date)
    average_house_prices = pd.DataFrame(average_house_prices).reset_index()
    average_house_prices.columns = ["date", "price"]
    average_house_prices["year_month"] = average_house_prices["date"].apply(lambda x: x.strftime("%Y-%m"))
    average_house_prices_dict = average_house_prices.set_index("year_month")["price"].to_dict()
    return average_house_prices_dict

def adjusted_house_value_median_sales_price(index_date, mortgage_rate_data, average_house_prices):
    index_year = index_date.year
    index_month = index_date.month
    index_price = average_house_prices.get(f"{index_year}-{index_month:02d}", None)
    if index_price is None:
        previous_date = None
        for year_month in sorted(average_house_prices.keys()):
            year, month = map(int, year_month.split("-"))
            if datetime.date(year, month, 1) > index_date:
                break
            previous_date = year_month
        if previous_date is None:
            raise ValueError("No median sales price data found for the specified date or any prior date.")
        index_price = average_house_prices[previous_date]

    if index_price == 0:
        raise ValueError(f"No median sales price data found for {index_year}-{index_month:02d}")
    index_payment = calculate_monthly_mortgage(index_price, index_year, index_month, mortgage_rate_data)

    house_values = {}
    for year_month, rate in mortgage_rate_data.items():
        year, month = map(int, year_month.split('-'))
        date = datetime.date(year, month, 1)

        monthly_interest_rate = (rate / 100) / 12
        num_payments = 30 * 12
        house_value = index_payment * ((1 + monthly_interest_rate)**num_payments - 1) / (monthly_interest_rate * (1 + monthly_interest_rate)**num_payments)
        house_values[date] = house_value

    dates = sorted(house_values.keys())
    adjusted_values = [house_values[date] for date in dates]
    average_prices = [average_house_prices.get(date.strftime("%Y-%m"), None) for date in dates]

    # Replace missing values with the previous non-missing value
    previous_value = None
    for i in range(len(average_prices)):
        if average_prices[i] is not None:
            previous_value = average_prices[i]
        else:
            average_prices[i] = previous_value

    fig = sp.make_subplots(rows=2, cols=1, shared_xaxes=True, vertical_spacing=0.1,
                           subplot_titles=("Adjusted House Value Based on Mortgage Payment and Median Sales Price",
                                           "30-Year Fixed Rate Mortgage Average in the United States / Effective Federal Funds Rate",
                                           ),
                           specs=[[{"secondary_y": True}], [{"secondary_y": True}]])

    # Add the main plot trace to the subplots figure
    fig.add_trace(go.Scatter(x=dates, y=adjusted_values, mode="lines", name="Adjusted House Value"), row=1, col=1)
    fig.add_trace(go.Scatter(x=dates, y=average_prices, mode="lines", name="Median Sales Price"), row=1, col=1, secondary_y=True)
    fig.add_trace(go.Scatter(x=[index_date], y=[index_price], mode="markers", marker=dict(color="red", size=8),
                             name=f"Index Value (${index_price:.2f})"), row=1, col=1, secondary_y=True)

    # Add traces for mortgage rates and federal funds rates
    fig.add_trace(go.Scatter(x=dates, y=mortgage_rates, mode="lines", name="Mortgage Rates"), row=2, col=1)
    fig.add_trace(go.Scatter(x=dates, y=federal_funds_rates, mode="lines", name="Federal Funds Rates"), row=2, col=1, secondary_y=True)

    # Update the layout for the subplots figure
    fig.update_layout(title="Adjusted House Value Based on Mortgage Payment and Median Sales Price",
                      xaxis_title="Date", yaxis_title="Adjusted House Value ($)")

    fig.update_yaxes(title_text="Median Sales Price ($)", secondary_y=True, row=1, col=1)
    fig.update_yaxes(title_text="Mortgage Rates (%)", row=2, col=1)
    fig.update_yaxes(title_text="Federal Funds Rates (%)", secondary_y=True, row=2, col=1)

    pio.show(fig)
    pyo.plot(fig, filename="output.html", auto_open=False)


if __name__ == '__main__':
    start_date = datetime.date(1972, 1, 1)
    end_date = datetime.date(2023, 5, 1)
    price = 449300
    # index_date = datetime.date(2022, 4, 1)
    index_date = datetime.date(2023, 4, 1)

    # Fetch data for the two new subplots
    historical_mortgage_rates = get_historical_mortgage_rates(api_key, 'MORTGAGE30US', start_date, end_date)
    average_house_prices = get_average_house_prices(api_key, 'MSPUS', start_date, end_date)
    federal_funds_rates = get_historical_mortgage_rates(api_key, 'FEDFUNDS', start_date, end_date)

    dates = sorted(set(list(historical_mortgage_rates.keys()) + list(average_house_prices.keys()) + list(federal_funds_rates.keys())))
    dates = [datetime.datetime.strptime(date, "%Y-%m").date() for date in dates]

    mortgage_rates = [historical_mortgage_rates.get(date.strftime("%Y-%m"), None) for date in dates]
    federal_funds_rates = [federal_funds_rates.get(date.strftime("%Y-%m"), None) for date in dates]

    monthly_mortgage_payment = calculate_monthly_mortgage(price, index_date.year, index_date.month, historical_mortgage_rates)
    print(f"Monthly mortgage payment: ${monthly_mortgage_payment:.2f}")

    adjusted_house_value_median_sales_price(index_date, historical_mortgage_rates, average_house_prices)


This code does require a config.py file with a reference to your own FRED API key which can be obtained here – https://fredaccount.stlouisfed.org/apikeys

api_key = ‘xxxxxxxxxxxxxxxxxxxxxxxxxxxxxx’

Automating the Management of Hundreds of TreasuryDirect.gov accounts

If you manage multiple accounts through TreasuryDirect.gov to purchase T-bills, T-notes, T-bonds, TIPS, FRNs, or C of I certificates then you know how antiquated and difficult it can be to manage all of your accounts at the United States Treasury. I’ve written a Python program to aggregate all of these accounts into a single summary Excel document. This program can be expanded to buy and sell securities. However, in its published state is simply aggregates all the data and returns it to a CSV file.

The program is written in Python and uses the Selenium WebDriver to interact with the TreasuryDirect.gov website. The program is designed to work with multiple accounts, and it reads the account information from a CSV file. It also has a feature to bypass the one-time password by logging in to your email and extracting the OTP. The program works by logging in to each account, checking the account details, and updating the account information as needed. It currently returns the following data:

Automating the login to each account

To do this, the program reads a CSV file containing all of your TreasuryDirect.gov account numbers and other relevant information, such as LLC names and purchase amounts. It then loops through each account, retrieves the necessary information from the TreasuryDirect.gov website using Selenium, and saves the data into a new column of the CSV file.

Here’s an example of the code that performs this task:

import pandas as pd
from treasury_direct import process_account

if __name__ == '__main__':
    df = pd.read_csv('accounts.csv')
    url = "https://www.treasurydirect.gov/RS/UN-Display.do"

    for index, row in df.iterrows():
        account_number = row['Treasury Direct']

        # Check if the row is already complete
        if not pd.isna(row['LLC Name']) and not pd.isna(row['Original Purchase Amount']) \
                and not pd.isna(row['Current Value']) and not pd.isna(row['Issue Date']) \
                and not pd.isna(row['Interest Rate']):
            continue

        success = process_account(account_number, df, index, url)

        if success:
            time.sleep(60)

    df.to_csv('accounts.csv', index=False)


Automatically retrieving one-time passcodes (OTPs) from emails

To log into each account, the program needs to retrieve OTPs from emails sent by TreasuryDirect.gov. It uses the Gmail API to search for unread emails from TreasuryDirect.gov containing the subject line “One Time Passcode” and retrieves the OTP from the email body. Once it has the OTP, the program enters it into the appropriate field on the TreasuryDirect.gov login page.

Here’s an example of the code that retrieves OTPs:

from gmail import get_otp

# Perform the one-time password process here
# Enter the OTP in the input field
# Continuously try to get OTP from the email until it's received
otp = None
while otp is None:
    otp = get_otp()
    if otp is None:
        # Sleep for 10 seconds before trying again
        time.sleep(10)
otp_input = driver.find_element_by_name("otp")
otp_input.send_keys(otp)


Finding the OTP in the email

      else:
            # Get the first unread email
            message = messages[0]
            msg = service.users().messages().get(userId='me', id=message['id'], format='full').execute()
            msg_str = base64.urlsafe_b64decode(msg['payload']['body']['data']).decode()
            otp = msg_str.splitlines()[6].split()[0]
            if otp:
                one_time_passcode = otp
                print(f"{one_time_passcode}")
                return one_time_passcode
            else:
                print("No One Time Passcode found in the email.")
                return None

Moving OTP emails to trash

To avoid cluttering your inbox, the program moves OTP emails to the trash folder after retrieving the OTPs. It uses the Gmail API to search for emails from TreasuryDirect.gov containing the subject line “One Time Passcode” and moves them to the trash folder.

Here’s an example of the code that moves OTP emails to trash:

def move_otp_emails_to_trash():
    try:
        creds = get_credentials()
        service = build('gmail', 'v1', credentials=creds)
        results = service.users().messages().list(userId='me',
                                                  q='from:Treasury.Direct@fiscal.treasury.gov subject:"One Time Passcode"').execute()
        messages = results.get('messages', [])
        if not messages:
            print('No messages found.')
        else:
            for message in messages:
                service.users().messages().trash(userId='me', id=message['id']).execute()
                print(f"Moved message with ID {message['id']} to trash.")
    except HttpError as error:
        print(f'An error occurred: {error}')

Extracting Account Information

    try:
        # Locate the elements containing the desired information
        llc_and_account_number = driver.find_element_by_xpath('//div[@id="accountnumber"]').text
        original_purchase_amount = driver.find_element_by_xpath('//p[contains(text(), "Series I current holdings total amount")]/span').text
        current_value = driver.find_element_by_xpath('//p[contains(text(), "Series I current holdings current value")]/span').text
        issue_date = driver.find_element_by_xpath('(//tr[contains(@class, "altrow")]/td)[3]').text
        interest_rate = driver.find_element_by_xpath('//td[contains(text(), "%")]').text

        # Separate the LLC name and account number
        llc_name, account_number = llc_and_account_number.split(':', 1)
        llc_name = llc_name.strip().replace("LLC Name: ", "")
        account_number = account_number.strip()

        # Print the extracted information
        print(f"LLC Name: {llc_name}")
        print(f"Account Number: {account_number}")
        print(f"Original Purchase Amount: {original_purchase_amount}")
        print(f"Current Value: {current_value}")
        print(f"Issue Date: {issue_date}")
        print(f"Interest Rate: {interest_rate}")

        # Save the extracted information as new columns for the current row
        df.loc[index, 'LLC Name'] = llc_name
        df.loc[index, 'Original Purchase Amount'] = original_purchase_amount
        df.loc[index, 'Current Value'] = current_value
        df.loc[index, 'Issue Date'] = issue_date
        df.loc[index, 'Interest Rate'] = interest_rate
    except NoSuchElementException:
        print(f"Failed to extract ibond information for account {account_number}. Moving to the next account.")


    try:
        bank_name = driver.find_element_by_xpath('//tr[@class="altrow1"][1]/td[3]/strong').text
        routing_number = driver.find_element_by_xpath('//tr[@class="altrow1"][2]/td[3]/strong').text
        account_number = driver.find_element_by_xpath('//tr[@class="altrow1"][3]/td[3]/strong').text
        names_on_account = driver.find_element_by_xpath('//tr[@class="altrow1"][4]/td[3]/strong').text
        account_type = driver.find_element_by_xpath('//tr[@class="altrow1"][5]/td[3]/strong').text
        return_code = driver.find_element_by_xpath('//tr[@class="altrow1"][6]/td[3]/strong').text

        # Print the extracted information
        print("Bank Name:", bank_name)
        print("Routing Number:", routing_number)
        print("Account Number:", account_number)
        print("Name(s) on Account:", names_on_account)
        print("Account Type:", account_type)
        print("Return Code:", return_code)

        # Save the extracted information as new columns for the current row
        df.loc[index, 'Bank Name'] = bank_name
        df.loc[index, 'Routing Number'] = routing_number
        df.loc[index, 'Account Number'] = account_number
        df.loc[index, 'Name(s) on Account'] = names_on_account
        df.loc[index, 'Account Type'] = account_type
        df.loc[index, 'Return Code'] = return_code

    except NoSuchElementException:
        print(f"Failed to extract information for account {account_number}. Moving to the next account.")

Full Code:

Coming soon.

Evaluating Optimization Algorithms for Ornstein-Uhlenbeck with Synthetic Data: A Comparison of Accuracy and Speed

In the realm of algorithm analysis, it is easy to become preoccupied with testing on actual datasets where variables remain unknown. However, to assess algorithms for speed and accuracy, one can generate known synthetic data and evaluate how closely the algorithms approximate the actual values and how quickly the calculations are performed. This approach serves as a litmus test for algorithms before implementation in production, and also aids in identifying syntax errors or issues in the underlying mathematical models.

  1. Generating Synthetic Data:

The synthetic data for this experiment is generated using the Ornstein-Uhlenbeck (OU) process, a mean-reverting stochastic process frequently employed in finance and other fields. The following code demonstrates how to generate synthetic data using the OU process:

import numpy as np

np.random.seed(42)

# Synthetic data generation
mu_true = 109
theta_true = 22
sigma_true = 23
dt = 0.01
N = 10000

X = np.zeros(N)
X[0] = mu_true
noise = np.random.normal(0, sigma_true * np.sqrt(dt), N - 1)

for i in range(1, N):
    X[i] = X[i - 1] * np.exp(-theta_true * dt) + mu_true * (1 - np.exp(-theta_true * dt)) + noise[i - 1]
  1. Evaluating Optimization Algorithms:

In this experiment, we will compare the performance of different optimization algorithms on the synthetic dataset generated above. The algorithms under evaluation include:

  • Maximum Likelihood Estimation (MLE)
  • Least Squares Estimation (LSE)
  • Bayesian Estimation
  • Method of Moments (MOM)
  • Kalman Filter Estimation
  1. Defining the Objective Function:

An objective function is required to evaluate the accuracy of the optimization algorithms. In this case, we use the negative log-likelihood function, which is commonly employed for maximum likelihood estimation (MLE).

  1. Implementing the Experiment:

To compare the accuracy and speed of the optimization algorithms, we will run each algorithm on the synthetic dataset and measure their performance. We will use the scipy.optimize.minimize function from the SciPy library to implement the algorithms.

  1. Analyzing the Results:

We will analyze the results by comparing the estimated parameters and the true parameters of the synthetic data. We will also compare the speed of each algorithm by measuring the time taken to converge to the optimal solution.

  1. Key Insights and Recommendations:

Based on the comparison, we will discuss the key insights and recommendations for selecting the most suitable optimization algorithm for a particular problem.

Conclusion:

By using synthetic data, we can effectively evaluate the performance of different optimization algorithms in terms of accuracy and speed. This analysis can help data scientists and researchers make informed decisions when choosing an optimization algorithm for their specific problem. Furthermore, synthetic data can be a valuable tool for improving existing algorithms or developing new ones.

Here is my complete code with examples.

This code is not meant to be conclusive but rather to show an example. For instance, many of these algorithms need parameter adjustments to be more accurate or beneficial in any way.

import os
import sys
import pandas as pd
import numpy as np
from scipy.stats import norm
import matplotlib.pyplot as plt
from datetime import datetime, timedelta
import plotly.graph_objs as go
import plotly.offline as pyo
from plotly.subplots import make_subplots
import pickle
from tqdm import tqdm
from typing import Union, List
from utils import filtered_df
from scipy.optimize import minimize, fmin
from statsmodels.base.model import LikelihoodModel, GenericLikelihoodModel


parent_dir = os.path.abspath(os.path.join(os.getcwd(), '..'))
data_dir = os.path.join(parent_dir, 'data/')
sys.path.append(data_dir)

file_path = os.path.join(data_dir, 'shortable_active_adj_close.pickle')
df = pd.read_pickle(file_path)

def absolute_relative_difference_errors(params, mu, observations, dt):
    theta, sigma = params  # Remove mu from here
    y_true, y_pred = np.array(observations), np.zeros(len(observations))
    y_pred[0] = y_true[0]

    random_noise = np.random.normal(0, np.sqrt(dt), size=len(observations) - 1)
    y_pred[1:] = y_true[:-1] + theta * (mu - y_true[:-1]) * dt + sigma * random_noise

    abs_diff_y_true = np.abs(np.diff(y_true, prepend=y_true[0]))
    abs_y_error = np.abs(y_true - y_pred)

    # Safely divide, avoiding division by zero
    relative_difference_errors = np.divide(abs_y_error, abs_diff_y_true, where=(abs_diff_y_true != 0))
    return np.sum(relative_difference_errors)


def optimize_mean_absolute_relative_difference_error(params, observations, dt):
    theta, mu, sigma = params
    n = len(observations)
    ou_predictions = np.zeros(n)
    ou_predictions[0] = observations[0]

    random_noise = np.random.normal(0, np.sqrt(dt), size=n - 1)
    ou_predictions[1:] = observations[:-1] + theta * (mu - observations[:-1]) * dt + sigma * random_noise

    errors = absolute_relative_difference_errors(observations, ou_predictions)
    return np.sum(errors)


# Update optimization functions to pass mu as an additional argument
def optimize_nelder_mead(observations, dt, theta_init, mu, sigma_init):
    initial_guess = [theta_init, sigma_init]  # Remove mu from here
    result = minimize(absolute_relative_difference_errors, initial_guess, args=(mu, observations, dt), method='Nelder-Mead')
    return result.x

def optimize_bfgs(observations, dt, theta_init, mu, sigma_init):
    initial_guess = [theta_init, sigma_init]  # Remove mu from here
    result = minimize(absolute_relative_difference_errors, initial_guess, args=(mu, observations, dt), method='BFGS')
    return result.x

def optimize_powell(observations, dt, theta_init, mu, sigma_init):
    initial_guess = [theta_init, sigma_init]  # Remove mu from here
    result = minimize(absolute_relative_difference_errors, initial_guess, args=(mu, observations, dt), method='Powell')
    return result.x

def optimize_lbfgsb(observations, dt, theta_init, mu, sigma_init):
    initial_guess = [theta_init, sigma_init]  # Remove mu from here
    result = minimize(absolute_relative_difference_errors, initial_guess, args=(mu, observations, dt), method='L-BFGS-B')
    return result.x

def optimize_tnc(observations, dt, theta_init, mu, sigma_init):
    initial_guess = [theta_init, sigma_init]  # Remove mu from here
    result = minimize(absolute_relative_difference_errors, initial_guess, args=(mu, observations, dt), method='TNC')
    return result.x

def mean_squared_error(y_true, y_pred):
    return np.mean((y_true - y_pred) ** 2)

def mean_absolute_error(y_true, y_pred):
    return np.mean(np.abs(y_true - y_pred))

def mean_absolute_percentage_error(y_true, y_pred):
    y_true, y_pred = np.array(y_true), np.array(y_pred)
    return np.mean(np.abs((y_true - y_pred) / y_true)) * 100

def mean_absolute_relative_difference_error(y_true: Union[List[float], np.ndarray], y_pred: Union[List[float], np.ndarray]) -> float:
    """
    Calculate the mean absolute relative difference error for the given true and predicted values.

    :param y_true: List or numpy array of true values
    :param y_pred: List or numpy array of predicted values
    :return: Mean absolute volatility error (in percentage)
    """
    # Convert input lists to numpy arrays
    y_true, y_pred = np.array(y_true), np.array(y_pred)

    # Check if there are less than two elements in y_true
    if len(y_true) < 2:
        return np.nan

    # Calculate the absolute differences between consecutive elements in y_true
    if len(y_true) == 2:
        abs_diff_y_true = np.abs(y_true[1] - y_true[0])
    else:
        abs_diff_y_true = np.abs(np.diff(y_true))
        # Insert the first difference value at the beginning of the array
        abs_diff_y_true = np.insert(abs_diff_y_true, 0, abs_diff_y_true[0])

    # Replace any zero values with a small value (epsilon) to prevent division by zero
    abs_diff_y_true = np.where(abs_diff_y_true == 0, np.finfo(float).eps, abs_diff_y_true)

    # Calculate the absolute differences between y_true and y_predict
    abs_y_error = np.abs(y_true - y_pred)

    # Calculate mean absolute volatility error (in percentage)
    return np.mean(abs_y_error / abs_diff_y_true)

def compute_direction_accuracy(y_true, y_pred):
    direction_actual = np.sign(np.array(y_true[1:]) - np.array(y_true[:-1]))
    direction_predicted = np.sign(np.array(y_pred[1:]) - np.array(y_pred[:-1]))
    return np.mean(direction_actual == direction_predicted)


import numpy as np
import pandas as pd
from scipy.optimize import minimize
from sklearn.metrics import mean_squared_error, mean_absolute_error, r2_score
import plotly.graph_objs as go
from plotly.subplots import make_subplots
import plotly.offline as pyo
import os

def plot_best_method_chart(symbol, method_name, metrics, data, predictions, rolling_mse, rolling_rmse, rolling_mae, rolling_marde, rolling_mape, rolling_r2, rolling_dir, best_theta, best_mu, best_sigma):
    fig = make_subplots(rows=4, cols=1, shared_xaxes=True,
                        subplot_titles=("Original and Predicted Values", "Difference between Actual and Predicted",
                                        "Metrics", "R2"),
                        vertical_spacing=0.025,
                        row_heights=[0.5, 0.1, 0.2, 0.2],
                        )

    fig.add_trace(go.Scatter(x=data.index[252:], y=data[252:], mode="lines", name="Original"), row=1, col=1)
    fig.add_trace(go.Scatter(x=predictions.index[252:], y=predictions[252:], mode="markers", name="Predicted"),
                  row=1, col=1)

    differences = data[252:] - predictions[252:]
    fig.add_trace(go.Scatter(x=differences.index, y=differences, mode="lines", name="Difference"), row=2, col=1)

    # Add metric subplots
    fig.add_trace(go.Scatter(x=data.index[252:len(data) - 1], y=rolling_mse, mode="lines", name="MSE"), row=3,
                  col=1)
    fig.add_trace(go.Scatter(x=data.index[252:len(data) - 1], y=rolling_rmse, mode="lines", name="RMSE"), row=3,
                  col=1)
    fig.add_trace(go.Scatter(x=data.index[252:len(data) - 1], y=rolling_mae, mode="lines", name="MAE"), row=3,
                  col=1)
    fig.add_trace(go.Scatter(x=data.index[252:len(data) - 1], y=rolling_marde, mode="lines", name="MARDE"), row=3,
                  col=1)
    fig.add_trace(go.Scatter(x=data.index[252:len(data) - 1], y=rolling_mape, mode="lines", name="MAPE"), row=3,
                  col=1)
    fig.add_trace(go.Scatter(x=data.index[252:len(data) - 1], y=rolling_dir, mode="lines", name="Direction Accuracy"), row=3, col=1)
    fig.add_trace(go.Scatter(x=data.index[252:len(data) - 1], y=rolling_r2, mode="lines", name="R2"), row=4, col=1)


    fig.add_annotation(xref="paper", yref="paper", xanchor='left', yanchor='top', x=0.0, y=1,
                       text=f"<b>{method_name} Metrics</b><br>"
                            f"MSE: {metrics[method_name]['MSE']:.4f}<br>"
                            f"RMSE: {metrics[method_name]['RMSE']:.4f}<br>"
                            f"MAE: {metrics[method_name]['MAE']:.4f}<br>"
                            f"MARDE: {metrics[method_name]['MARDE']:.4f}<br>"
                            f"MAPE: {metrics[method_name]['MAPE']:.4f}<br>"
                            f"R-squared: {metrics[method_name]['R2']:.4f}<br>"
                            f"Direction Accuracy: {metrics[method_name]['Direction Accuracy']:.4f}<br>"
                            f"Best theta: {best_theta:.4f}<br>"
                            f"Best mu: {best_mu:.4f}<br>"
                            f"Best sigma: {best_sigma:.4f}",
                       font=dict(size=12), align="center", showarrow=False)

    fig.update_layout(
        title=f"{symbol} and MARDE: {metrics[method_name]['MARDE']:.4f}",
        title_x=0.5,
        title_y=0.95,
        title_xanchor="center",
        title_yanchor="top",
    )

    if not os.path.exists("plots"):
        os.makedirs("plots")

    plot_file = f"plots/{symbol}_{method_name}_marde{metrics[method_name]['MARDE']:.4f}_theta{best_theta:.4f}_mu{best_mu:.4f}_sigma{best_sigma:.4f}.html"
    pyo.plot(fig, filename=plot_file, auto_open=False)

    print(f"Plot saved as {plot_file}")

def save_analysis_to_dataframe(symbol, method_name, metrics, theta, mu, sigma, filename="ornstein_uhlenbeck_pairs_analysis"):
    # Create a DataFrame with the specified index and columns
    columns = ["Theta", "Mu", "Sigma", "Best Method", "MSE", "RMSE", "MAE", "MAPE", "MARDE", "R2"]
    analysis_df = pd.DataFrame(index=[symbol], columns=columns)

    # Add the data to the DataFrame
    analysis_df.loc[symbol] = [theta, mu, sigma, method_name, metrics[method_name]['MSE'],
                                metrics[method_name]['RMSE'], metrics[method_name]['MAE'],
                                metrics[method_name]['MARDE'], metrics[method_name]['MARDE'],
                                metrics[method_name]['R2'], metrics[method_name]['Direction Accuracy']]

    # Save the DataFrame to disk using the pickle library
    with open(filename + ".pkl", "wb") as file:
        pickle.dump(analysis_df, file)

    print(f"Analysis saved as {filename}.pkl")

def ornstein_uhlenbeck(filename='cointegrated_etf_pairs_historical_ratios.pkl', make_stationary=False, plot_all_charts=True, output_file="ornstein_uhlenbeck_pairs_analysis.pkl"):
    # Load the DataFrame from the specified pickle file
    file_path = os.path.join(data_dir, filename)
    with open(file_path, 'rb') as file:
        df = pickle.load(file)

    # Create a DataFrame to store the analysis for all symbols
    columns = ["Theta", "Mu", "Sigma", "Best Method", "MSE", "RMSE", "MAE", "MARDE", "MAPE", "R2", "Direction Accuracy"]
    all_symbols_analysis = pd.DataFrame(columns=columns)

    # Iterate through each column in the DataFrame
    for symbol in tqdm(df.columns, desc="Processing symbols", leave=False):
        # Select the symbol column and drop NaNs
        data = df[symbol].dropna()
        original_first_value = data.iloc[0]  # Save the first value before differencing

        # Apply first-differencing if make_stationary is True
        if make_stationary:
            data = data.diff().dropna()

        # Calculate dt
        index_diff = data.index[-1] - data.index[-2]
        dt = index_diff.days + index_diff.seconds / (60*60*24)
        # dt = dt/365 # for calendar
        dt = dt/252 # for trading days

        # Create a series to store predictions
        predictions = pd.Series(index=data.index, dtype='float64')

        best_method = None
        best_params = None
        best_rmse = float('inf')

        optimization_methods = [
            ('Nelder-Mead', optimize_nelder_mead),
            ('BFGS', optimize_bfgs),
            ('L-BFGS-B', optimize_lbfgsb),
            ('Powell', optimize_powell),
            ('TNC', optimize_tnc),
        ]
        metrics = {}
        best_parameters = {}
        rolling_metrics = {}
        method_predictions = {}


        for method_name, optimization_method in tqdm(optimization_methods, desc="Optimizing parameters", leave=False):
            all_predictions = []
            all_actuals = []

            theta_init = 2
            sigma_init = 2.9

            last_theta = None
            last_mu = None
            last_sigma = None

            rolling_mse = []
            rolling_rmse = []
            rolling_mae = []
            rolling_mape = []
            rolling_marde = []
            rolling_r2 = []
            rolling_dir_acc = []
            rolling_mu = []

            for i in range(252, len(data) - 1):
                if last_theta is None:
                    # First time running this optimization method, use initial values
                    theta_init, mu_init, sigma_init = theta_init, data[:i].mean(), sigma_init
                else:
                    # Use last calculated values as initial guess
                    # theta_init, mu_init, sigma_init = last_theta, last_mu, last_sigma
                    #this method does not allow mu to be optimized
                    theta_init, mu_init, sigma_init = last_theta, data[:i].mean(), last_sigma

                # Run optimization
                theta, sigma = optimization_method(data[i - 252:i].values, dt, theta_init, mu_init,
                                                   sigma_init)  # Unpack two values
                mu = data[i-252:i].mean()  # Calculate mu as the mean of the data up to the current index
                rolling_mu.append(mu)
                # Save the last calculated values
                last_theta, last_mu, last_sigma = theta, mu, sigma

                # print("All actuals:", all_actuals)
                # print("All predictions:", all_predictions)
                # Calculate prediction and save it to the predictions series
                ou_prediction = data[i] + theta * (mu - data[i]) * dt + sigma * np.random.normal(0, np.sqrt(dt))
                predictions[i + 1] = ou_prediction

                # Save actual and predicted values for computing metrics later
                all_predictions.append(ou_prediction)
                all_actuals.append(data[i + 1])

                # print("All actuals:", all_actuals)
                # print("All predictions:", all_predictions)

                # Calculate the rolling metrics
                mse = mean_squared_error(np.array(all_actuals), np.array(all_predictions))
                rmse = np.sqrt(mse)
                mae = mean_absolute_error(np.array(all_actuals), np.array(all_predictions))
                marde = mean_absolute_relative_difference_error(np.array(all_actuals), np.array(all_predictions))
                mape = mean_absolute_percentage_error(np.array(all_actuals), np.array(all_predictions))
                r2 = r2_score(np.array(all_actuals), np.array(all_predictions))
                dir_acc = compute_direction_accuracy(np.array(data[i-252:i]), np.array(predictions[i-252:i]))

                # Append the rolling metrics to their respective lists
                rolling_mse.append(mse)
                rolling_rmse.append(rmse)
                rolling_mae.append(mae)
                rolling_marde.append(marde)
                rolling_mape.append(mape)
                rolling_r2.append(r2)
                rolling_dir_acc.append(dir_acc)

                rolling_metrics[method_name] = {
                    'rolling_mse': rolling_mse,
                    'rolling_rmse': rolling_rmse,
                    'rolling_mae': rolling_mae,
                    'rolling_marde': rolling_marde,
                    'rolling_mape': rolling_mape,
                    'rolling_r2': rolling_r2,
                    'rolling_direction_accuracy': rolling_dir_acc,


                }

                method_predictions[method_name] = predictions.copy()

                # Compute metrics for this optimization method
            if len(all_actuals) > 0 and len(all_predictions) > 0:
                mse = mean_squared_error(np.array(all_actuals), np.array(all_predictions))
                rmse = np.sqrt(mse)
                mae = mean_absolute_error(np.array(all_actuals), np.array(all_predictions))
                marde = mean_absolute_relative_difference_error(np.array(all_actuals), np.array(all_predictions))
                mape = mean_absolute_percentage_error(np.array(all_actuals), np.array(all_predictions))
                r2 = r2_score(np.array(all_actuals), np.array(all_predictions))
                direction_accuracy = compute_direction_accuracy(np.array(all_actuals), np.array(all_predictions))

                metrics[method_name] = {'MSE': mse, 'RMSE': rmse, 'MAE': mae, 'MARDE': marde, 'MAPE': mape, 'R2': r2,
                                        'Direction Accuracy': direction_accuracy}

                best_parameters[method_name] = {'theta': last_theta, 'mu': last_mu, 'sigma': last_sigma}

                print(f"Optimization method: {method_name}")
                print(f"Mean Squared Error: {mse}")
                print(f"Root Mean Squared Error: {rmse}")
                print(f"Mean Absolute Error: {mae}")
                print(f"Mean Absolute Volatility Error: {marde}%\n")
                print(f"Mean Absolute Percentage Error: {mape}%\n")
                print(f"R-squared: {r2}\n")
                print(f"Direction Accuracy: {direction_accuracy}\n")


                if plot_all_charts:
                    # Add the plotting code here
                    fig = make_subplots(rows=3, cols=1, shared_xaxes=True,
                                        subplot_titles=(
                                        "Original and Predicted Values", "Difference between Actual and Predicted",
                                        "Metrics"),
                                        vertical_spacing=0.05,
                                        row_heights=[0.5, 0.5, 0.5],
                                        )

                    fig.add_trace(go.Scatter(x=data.index[252:], y=data[252:], mode="lines", name="Original"), row=1,
                                  col=1)
                    fig.add_trace(
                        go.Scatter(x=predictions.index[252:], y=predictions[252:], mode="markers", name="Predicted"),
                        row=1, col=1)

                    fig.add_trace(
                        go.Scatter(x=data.index[252:], y=rolling_mu, mode="markers", name="Mu"),
                        row=1, col=1)

                    differences = data[252:] - predictions[252:]
                    fig.add_trace(go.Scatter(x=differences.index, y=differences, mode="lines", name="Difference"),
                                  row=2, col=1)

                    # Add metric subplots
                    fig.add_trace(go.Scatter(x=data.index[252:len(data) - 1], y=rolling_mse, mode="lines", name="MSE"),
                                  row=3, col=1)
                    fig.add_trace(go.Scatter(x=data.index[252:len(data) - 1], y=rolling_rmse, mode="lines", name="RMSE"),
                                  row=3, col=1)
                    fig.add_trace(go.Scatter(x=data.index[252:len(data) - 1], y=rolling_mae, mode="lines", name="MAE"),
                                  row=3,col=1)
                    fig.add_trace(go.Scatter(x=data.index[252:len(data) - 1], y=rolling_marde, mode="lines", name="MARDE"),
                                  row=3, col=1)
                    fig.add_trace(go.Scatter(x=data.index[252:len(data) - 1], y=rolling_mape, mode="lines", name="MAPE"),
                                  row=3, col=1)
                    fig.add_trace(go.Scatter(x=data.index[252:len(data) - 1], y=rolling_r2, mode="lines", name="R2"),
                                  row=3, col=1)
                    fig.add_trace(go.Scatter(x=data.index[252:len(data) - 1], y=rolling_dir_acc, mode="lines", name="Direction Accuracy"),
                                  row=3, col=1)

                    fig.add_annotation(xref="paper", yref="paper", xanchor='left', yanchor='top', x=0.0, y=1,
                                       text=f"<b>{method_name} Metrics</b><br>"
                                            f"MSE: {metrics[method_name]['MSE']:.4f}<br>"
                                            f"RMSE: {metrics[method_name]['RMSE']:.4f}<br>"
                                            f"MAE: {metrics[method_name]['MAE']:.4f}<br>"
                                            f"MARDE: {metrics[method_name]['MARDE']:.4f}<br>"
                                            f"MAPE: {metrics[method_name]['MAPE']:.4f}<br>"
                                            f"R-squared: {metrics[method_name]['R2']:.4f}<br>"
                                            f"Direction Accuracy: {metrics[method_name]['Direction Accuracy']:.4f}",
                                       font=dict(size=12), align="center", showarrow=False)

                    if not os.path.exists("plots"):
                        os.makedirs("plots")

                    plot_file = f"plots/{symbol}_ornstein_uhlenbeck_{method_name}.html"
                    pyo.plot(fig, filename=plot_file, auto_open=False)

                    print(f"Plot saved as {plot_file}")
            else:
                print("Skipping metric computation due to insufficient data.")

        if metrics:
            best_method = min(metrics, key=lambda x: metrics[x]['MAPE'])
        else:
            print("No metrics available for this symbol.")
            continue
        # best_method = max(metrics, key=lambda x: metrics[x]['R2'])

        best_mse = metrics[best_method]['MSE']
        best_rmse = metrics[best_method]['RMSE']
        best_mae = metrics[best_method]['MAE']
        best_marde = metrics[best_method]['MARDE']
        best_mape = metrics[best_method]['MAPE']
        best_r2 = metrics[best_method]['R2']
        best_dir_acc = metrics[best_method]['Direction Accuracy']

        best_theta = best_parameters[best_method]['theta']
        best_mu = best_parameters[best_method]['mu']
        best_sigma = best_parameters[best_method]['sigma']

        print(f"Best optimization method: {best_method}")
        print(f"Best values for theta: {best_theta}, mu: {best_mu}, sigma: {best_sigma}")
        print(f"Mean Squared Error: {best_mse}")
        print(f"Root Mean Squared Error: {best_rmse}")
        print(f"Mean Absolute Error: {best_mae}")
        print(f"Mean Absolute Relative Distance Error: {best_marde}")
        print(f"Mean Absolute Percentage Error: {best_mape}")
        print(f"R-squared: {best_r2}")
        print(f"Direction Accuracy: {best_dir_acc}")

        all_symbols_analysis.loc[symbol] = [best_theta, best_mu, best_sigma, best_method,
                                            metrics[best_method]['MSE'],
                                            metrics[best_method]['RMSE'], metrics[best_method]['MAE'],
                                            metrics[best_method]['MARDE'], metrics[best_method]['MAPE'],
                                            metrics[best_method]['R2'],
                                            metrics[best_method]['Direction Accuracy']]

                # Call the plot_best_method_chart function after determining the best_method
        plot_best_method_chart(
            symbol, best_method, metrics, data, method_predictions[best_method],
            rolling_metrics[best_method]['rolling_mse'],
            rolling_metrics[best_method]['rolling_rmse'],
            rolling_metrics[best_method]['rolling_mae'],
            rolling_metrics[best_method]['rolling_marde'],
            rolling_metrics[best_method]['rolling_mape'],
            rolling_metrics[best_method]['rolling_r2'],
            rolling_metrics[best_method]['rolling_direction_accuracy'],
            best_theta, best_mu, best_sigma
        )

        with open(output_file, "wb") as file:
            pickle.dump(all_symbols_analysis, file)
        # return best_method, best_theta, best_mu, best_sigma, best_mse, best_rmse, best_mae, best_marde, best_mape,best_r2


ornstein_uhlenbeck()

Your final results will look something like this.

True values: μ = 109.00, θ = 22.00, σ = 23.00
MLE estimates: μ = 923764.61, θ = -4591680.43, σ = 69817.80
Least Squares: μ = 108.97, θ = 23.72, σ = 1.00
Method of Moments: μ = 108.98, θ = 23.70, σ = 19.33
Kalman Filter: μ = 0.00, θ = 2.00, σ = 2.42
Ensemble prediction: μ = 108.98, θ = 23.70, σ = 19.33
MLE estimates (Nelder-Mead): μ = 0.00, θ = -3255.78, σ = 18095.76
MLE estimates (Powell): μ = -0.51, θ = -104.01, σ = 16.22
MLE estimates (CG): μ = -31431.14, θ = -159.34, σ = 8154.10
MLE estimates (BFGS): μ = -59278.98, θ = -1326.24, σ = 19548.41
MLE estimates (L-BFGS-B): μ = 0.77, θ = 4.98, σ = 5.30

Process finished with exit code 0
Mean Absolute Relative Difference Error (MARDE) Metric for Improved Forecasting Evaluation

I was running some machine learning models and was struggling to find a metric that could capture errors relative to volatility in the underlying model that I was trying to predict so I created MARDE. Commonly used metrics like Mean Absolute Error (MAE), Mean Absolute Percentage Error (MAPE), Mean Squared Error (MSE), and R-squared (R2) have limitations that failed to capture my model’s performance.

I created a new metric called Mean Absolute Relative Difference Error (MARDE), which addresses some of the shortcomings of the existing metrics. MARDE measures the average absolute error between the true and predicted values, relative to the consecutive differences in the true values. By considering the relative differences, MARDE offers a more nuanced evaluation of model performance, particularly in situations with varying volatility or fluctuating data patterns.

MARDE = (1/n) * Σ(abs_y_error_i / Δy_true_i) * 100, for i=1 to n

Here, Δy_true represents the absolute differences between consecutive elements in y_true, and abs_y_error represents the absolute differences between y_true and y_pred.


def mean_absolute_volatility_error(y_true: Union[List[float], np.ndarray], y_pred: Union[List[float], np.ndarray]) -> float:
    """
    Calculate the mean absolute volatility error for the given true and predicted values.

    :param y_true: List or numpy array of true values
    :param y_pred: List or numpy array of predicted values
    :return: Mean absolute volatility error (in percentage)
    """
    # Convert input lists to numpy arrays
    y_true, y_pred = np.array(y_true), np.array(y_pred)

    # Check if there are less than two elements in y_true
    if len(y_true) < 2:
        return np.nan

    # Calculate the absolute differences between consecutive elements in y_true
    if len(y_true) == 2:
        abs_diff_y_true = np.abs(y_true[1] - y_true[0])
    else:
        abs_diff_y_true = np.abs(np.diff(y_true))
        # Insert the first difference value at the beginning of the array
        abs_diff_y_true = np.insert(abs_diff_y_true, 0, abs_diff_y_true[0])

    # Calculate the absolute differences between y_true and y_pred
    abs_y_error = np.abs(y_true - y_pred)

    # Calculate mean absolute volatility error (in percentage)
    return np.mean(abs_y_error / abs_diff_y_true * 100)

Comparing MARDE to existing metrics:

  1. Mean Absolute Error (MAE): MAE measures the average absolute difference between the true and predicted values. However, it does not account for the inherent volatility or fluctuations in the data. MARDE considers this aspect by normalizing the error with respect to the consecutive differences in the true values.
    • MAE = (1/n) * Σ|y_true_i – y_pred_i|, for i=1 to n
  2. Mean Absolute Percentage Error (MAPE): MAPE is similar to MAE, but it normalizes the error by dividing it by the true value. While MAPE is useful for expressing errors in percentage terms, it can lead to biased results when dealing with very small or zero true values. MARDE overcomes this issue by using consecutive differences as the normalization factor.
    • MAPE = (1/n) * Σ(|(y_true_i – y_pred_i) / y_true_i|) * 100, for i=1 to n
  3. Mean Squared Error (MSE): MSE measures the average squared difference between the true and predicted values. It tends to penalize larger errors more heavily, which can be useful in some cases but might also overemphasize outliers. MARDE, on the other hand, focuses on the absolute differences and is less sensitive to extreme values.
    • MSE = (1/n) * Σ(y_true_i – y_pred_i)^2, for i=1 to n
  4. R-squared (R2): R2 measures the proportion of variance in the true values that can be explained by the model. While R2 is useful for assessing the overall goodness-of-fit, it does not provide a direct measure of the prediction error. MARDE, as a metric focused on errors, offers a complementary perspective to R2 in evaluating model performance.
    • R² = 1 – (SSR / SST)
    • SSR (Sum of Squared Residuals) is the sum of the squared differences between the actual dependent variable values (y) and the predicted values (ŷ) from the model;
    • SST (Total Sum of Squares) is the sum of the squared differences between the actual dependent variable values (y) and the mean of the dependent variable (ȳ).

The Mean Absolute Relative Difference Error (MARDE) is a valuable addition to the set of evaluation metrics used in forecasting and prediction tasks. By taking into account the consecutive differences in the true values, MARDE provides a more granular assessment of model performance, particularly in situations with fluctuating data patterns. It overcomes some of the limitations of existing metrics and can be employed alongside them for a comprehensive evaluation of prediction models.

How We Just Got Fucked by the Banking Elite and the FED… Again

As the Federal Reserve recently bailed out the wealthy bankers once again, the Bank Term Funding (BTFP) has been pushing the Fed’s balance sheet up from $8,342T on March 8 to $8,733T on March 22. This bailout is supposedly a short-term lending program, but with the banks’ financial houses in disarray, one can’t help but be skeptical.

The goal here is to shed light on how six of the largest US banks, including Charles Schwab Corp. and PNC Financial Services Group Inc., used a simple accounting maneuver to shield billions of dollars of losses from their books. They changed the classification of over $500 billion of their bond investments to “held to maturity” from “available for sale,” effectively freezing the bonds’ values, no matter how far they fell in the market. But that isn’t the worse of it. The FED through BTFP has agreed to loan any bank money on the original value of these bonds.

This preferential treatment for bankers can be likened to an individual claiming they won’t sell their house any time soon(available for sale) but instead hold it forever(hold to maturity), insisting the Fed should give them a loan on the original purchase price even if it’s worth significantly less today. While the rest of us grapple with the consequences of Fed rate hikes aimed at curbing inflation, these bankers are granted special privileges, securing loans at rates unavailable to the general public. The glaring disparity raises the question of why the banking elite continues to enjoy such benefits, while the average person must bear the brunt of economic measures designed to slow inflation. The ongoing preferential treatment for the financial sector only serves to widen the gap between the wealthy and the rest, further entrenching social and economic disparities.

Let’s dig deeper into the numbers. These six banks had a combined $1.14 trillion balance-sheet value as of December 31, up from $681 billion a year earlier. This was primarily due to the reclassification of their bond investments. The $1.14 trillion figure was $118 billion (12%) higher than the bonds’ fair-market values. The $118 billion was equivalent to 18% of the banks’ total equity.

In 2021, the Fed’s peak balance sheet was $8,965T, and they forced the economic pain onto America and reduced it to $8,339T within a year. However, the recent bailout has undone a significant percentage of this reduction. The bailout increased the balance sheet from $8,342T on March 8 to $8,733T on March 22, representing an increase of $391.5B. This means that approximately 52.6% of the reduction within the last year has been wiped away in just two weeks!

It appears that the efforts to slow inflation are aimed primarily at the average person, while the bankers seem to be exempt from these measures. The disparity in treatment between the general public and the banking elite raises concerns about the fairness and effectiveness of the financial system, as the privileged few continue to enjoy benefits that are out of reach for most people.

But there’s another issue. This bailout also props up equities values and who does that benefit? Not the poor people, not even the bottom 50 percentile. So make no mistake this propping up of all these banks is a punch in the gut to all the people suffering economically.

Here are the executive compensations from the banks’ annual reports in 2021(not updated):

  1. Charles Schwab Corp.
    • Walter W. Bettinger II (President and CEO): Total Compensation – $17,145,128
    • Joseph R. Martinetto (Senior EVP and COO): Total Compensation – $9,283,784
    • Peter B. Crawford (EVP and CFO): Total Compensation – $6,238,985
    • Jonathan M. Craig (EVP and General Counsel): Total Compensation – $5,197,254
    • Christine R. Gaze (EVP and Chief Marketing Officer): Total Compensation – $5,007,660
    • Timothy D. Heier (EVP and Chief Human Resources Officer): Total Compensation – $4,706,484
    • Terri R. Kallsen (EVP and Head of Schwab Investor Services): Total Compensation – $4,520,833
    • Jeffrey M. Carney (SVP and Head of Schwab Institutional): Total Compensation – $4,192,170
  2. PNC Financial Services Group Inc.
    • William S. Demchak (Chairman and CEO): $16.5 million
    • Robert Q. Reilly (Executive Vice President and CFO): $6.4 million
    • E. William Parsley III (Vice Chairman and COO): $7.1 million
    • Richard K. Bynum (Chief Corporate Responsibility Officer): $2.7 million
    • Joseph Alvarado (Director): $278,160
    • Debra A. Cafaro (Director): $414,330
    • Linda R. Medler (Director): $367,510
    • Andrew T. Feldstein (Director): $391,710
    • Martin Pfinsgraff (Director): $364,670
    • Daniel Hesse (Director): $363,550
    • Michael J. Ward (Director): $361,170
    • Charles E. Bunch (Director): $363,550
    • William S. Parsley III (Director): $360,170
    • Marjorie Rodgers Cheshire (Director): $354,070
    • Steven C. Van Wyk (Director): $350,170
  3. U.S. Bancorp
    • Andrew Cecere, Chairman, President and CEO: $12,190,230
    • Terrance R. Dolan, Vice Chairman and CFO: $4,783,733
    • Gunjan Kedia, Vice Chairman and Chief Strategy Officer: $5,527,326
    • Mark J. Mulhern, Vice Chairman and Wealth Management & Investment Services: $4,386,123
    • Jodi N. Richard, Vice Chairman and Chief Risk Officer: $4,715,903
    • Christopher G. Van Gorder, Vice Chairman and Chief Risk Officer: $4,721,068
    • Jeffery A. von Gillern, Vice Chairman and Chief Credit Officer: $3,864,515
    • Ellen M. Zane, Vice Chairman and Independent Lead Director: $468,000
  4. Truist Financial Corp.
    • Kelly S. King (Chairman and CEO): $15.5 million
    • Daryl N. Bible (CFO): $6.9 million
    • William H. Rogers Jr. (COO): $14.3 million
    • Ellen M. Fitzsimmons (General Counsel): $5.5 million
    • David H. Weaver (Chief Risk Officer): $4.4 million
    • Brantley J. Standridge (Chief Data and Analytics Officer): $4.4 million
    • W. Bennett Bradley (President of Banking): $4.2 million
    • Clarke R. Starnes III (Chief Human Resources Officer): $3.5 million
    • Dontá L. Wilson (Chief Digital and Client Experience Officer): $3.5 million
    • Thomas E. Freeman (President of Truist Insurance Holdings): $2.9 million
    • William J. Chivers Jr. (President of Wholesale Banking): $2.8 million
    • Scott C. Case (President of Retail Community Bank): $2.6 million
    • Cynthia B. Day (Chief Diversity and Inclusion Officer): $2.1 million
    • Joseph K. Hannan (Chief Commercial Credit Officer): $2 million
    • Steven A. Lerner (Chief Communications Officer): $1.8 million
  5. Wells Fargo & Co.
    • Charles W. Scharf, CEO: $20.3 million
    • Michael L. Santomassimo, CFO: $9 million
    • Scott E. Powell, COO: $11.6 million
    • Avid Modjtabai, Senior EVP: $9.8 million
    • Lester Owens, Senior EVP: $7.6 million
    • William M. Daley, Vice Chairman: $6.4 million
    • Ellen Patterson, EVP: $6.2 million
    • Jonathan G. Weiss, Senior EVP: $5.7 million
    • Barry Sommers, CEO, Wealth & Investment Management: $5.5 million
    • Michael DeVito, Senior EVP: $5.1 million

The bottom line is that the banking elite is benefiting from accounting maneuvers and bailouts that leave the average person footing the bill. While the BTFP is still in progress and its final size remains unknown, one can’t help but wonder: do we really believe these banks will magically get their houses in working order? Or are we, once again, just bailing out the wealthy at the expense of the rest?