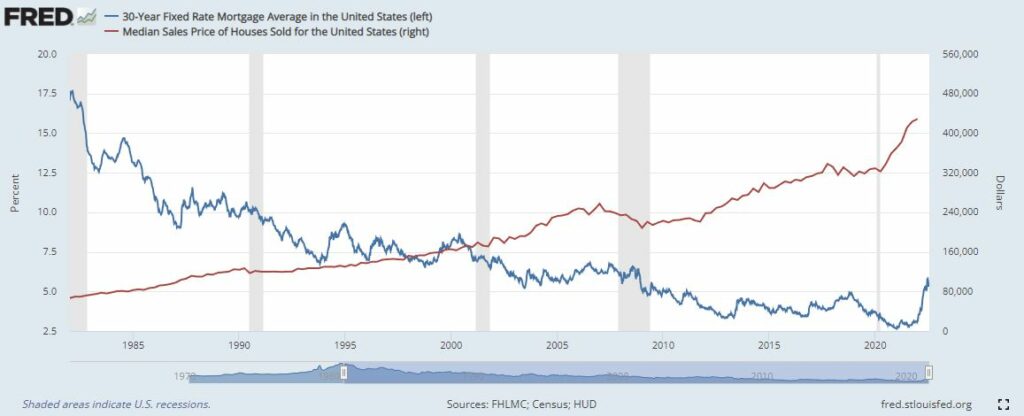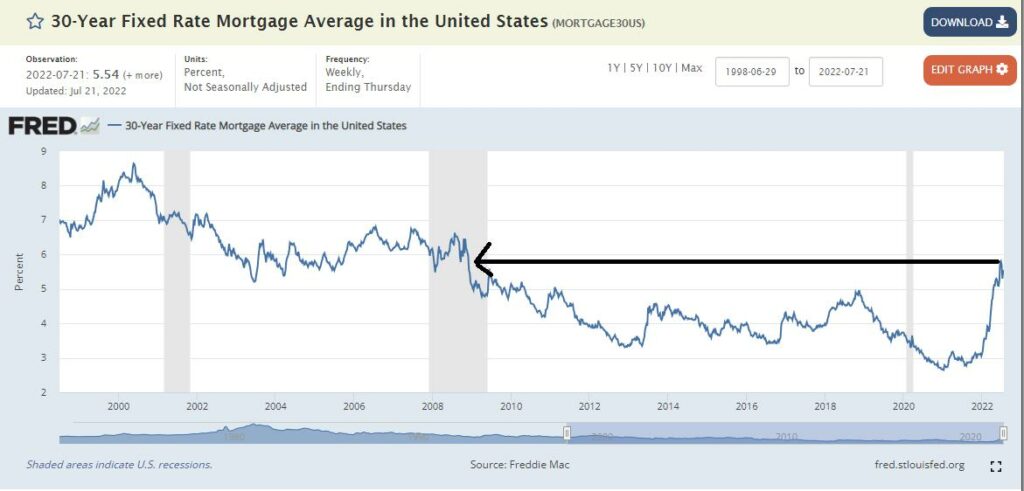
Call me crazy…But I believe affordability is the primary driver of housing prices. Mortgage rates determine payment. And payment determines affordability. This is rough rough rough math. But based on the inverse correlation between rates and housing prices you could easily derive from this chart a 30% drop in prices everything else being equal.
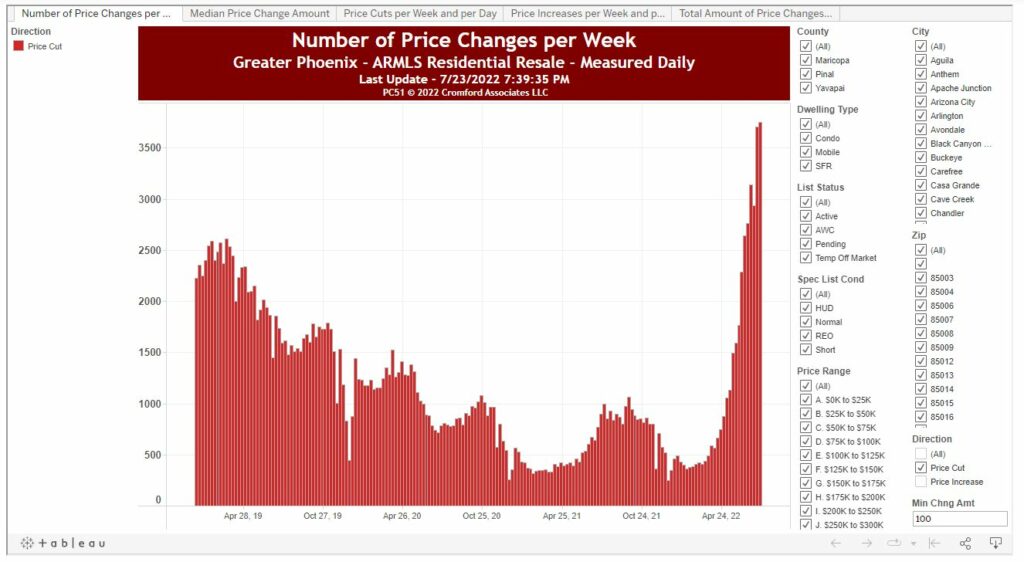
Buyers are still slashing prices as indicated in ‘Number of Price Changes per Week’. As long as this stays high or continues to grow there will be tremendous pressure continuing to push prices lower. Just because of psychological reasons if not anything else.
Based on the ‘average list price per square foot’ if you bought in the last year you are more than likely upside down. And technically you’re probably upside down if you bought anywhere near the end of 2020. Assuming a 6% reduction in your appreciation for selling fees.
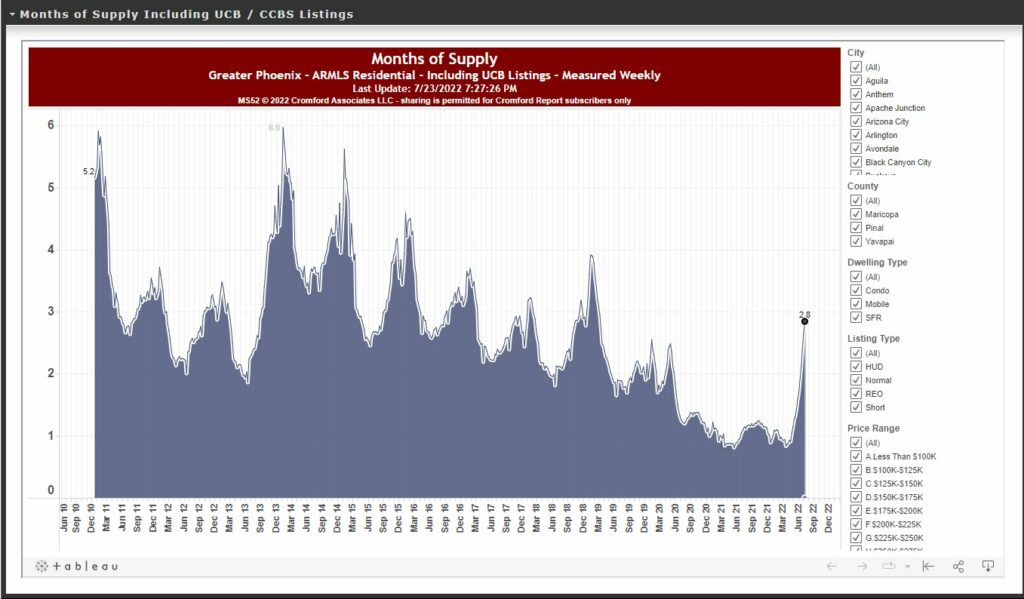
Supply now sits at 2.8 months. This typically peaks in Jan-Feb. So I think it will continue to climb. I wouldn’t be surprised if we’re back to supplies being where they were in 2015 before it peaks, Jan/Feb ’23.