Arizona Real Estate update 8.1.22

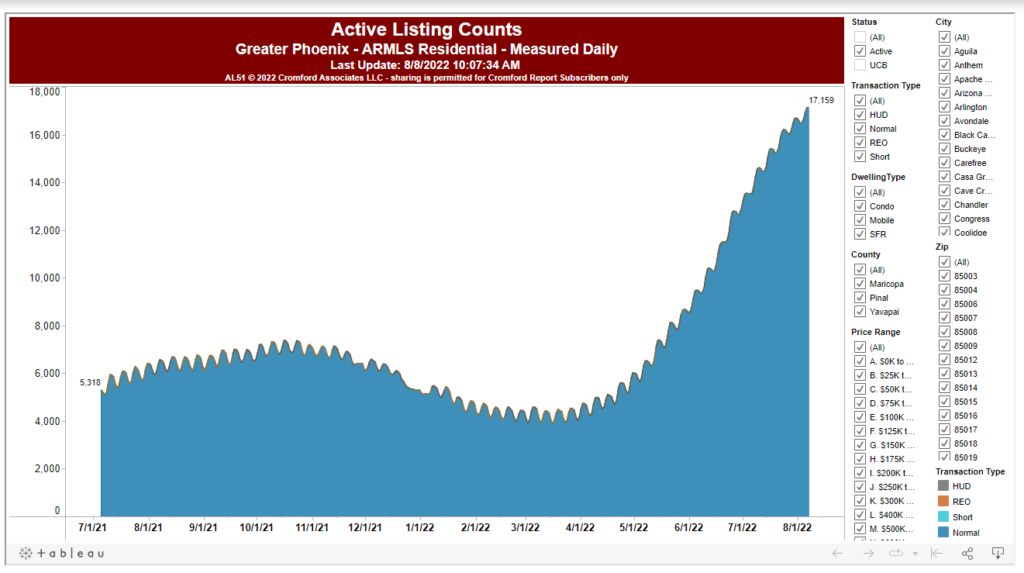
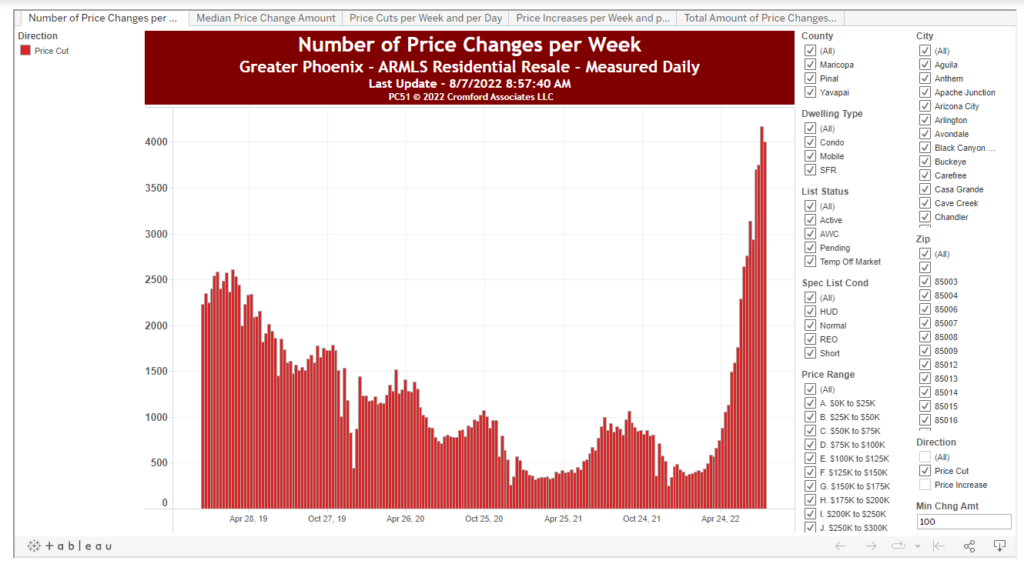
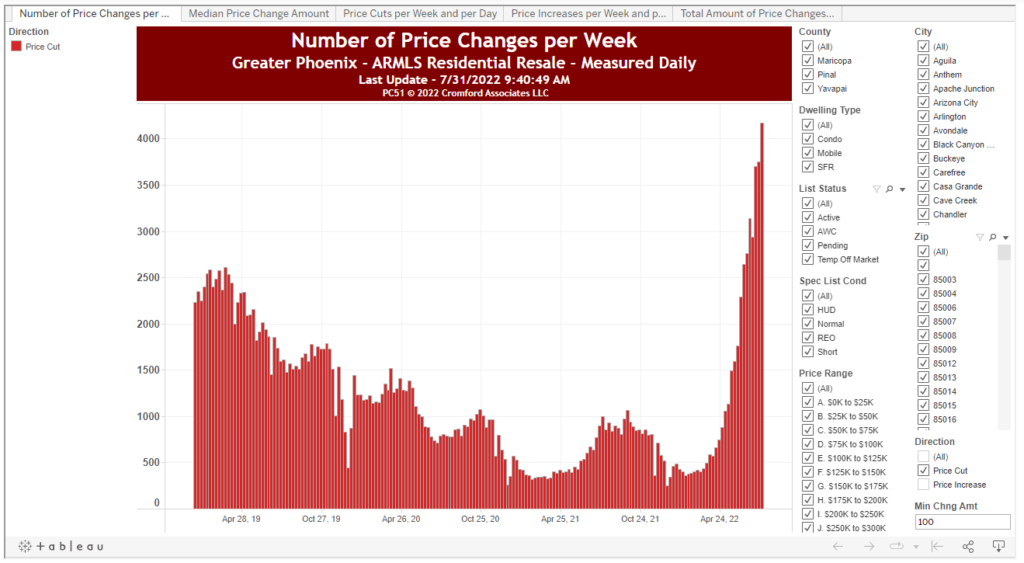
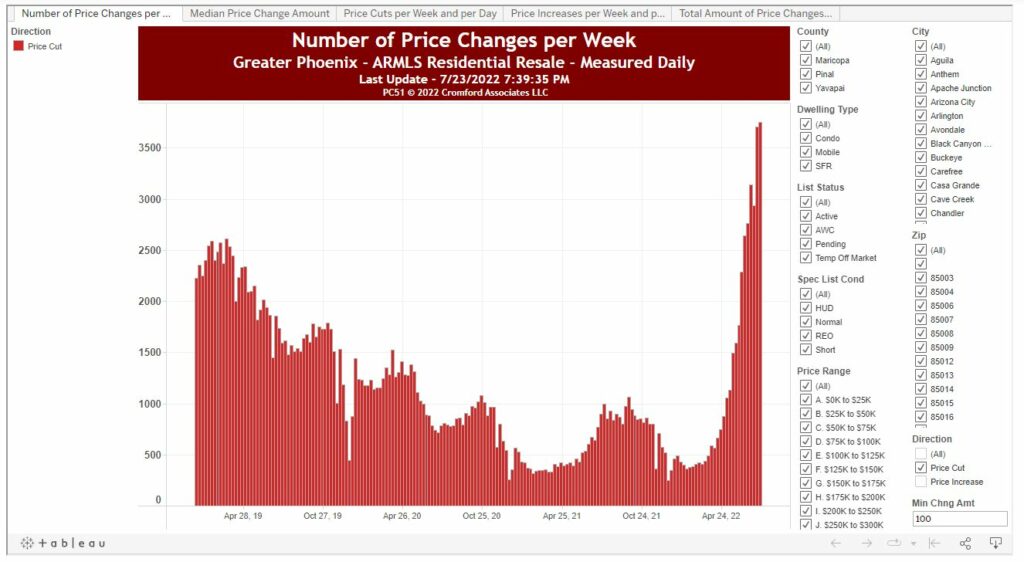
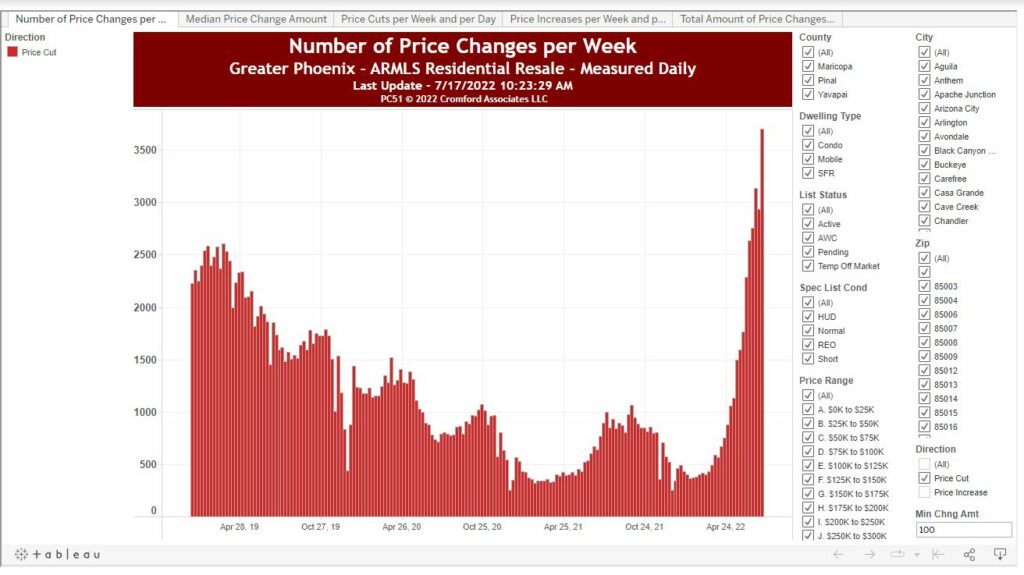
People are still slashing their listing prices. It increased to its highest level this week, 4,172. This will continue to put huge downward pressure on prices.

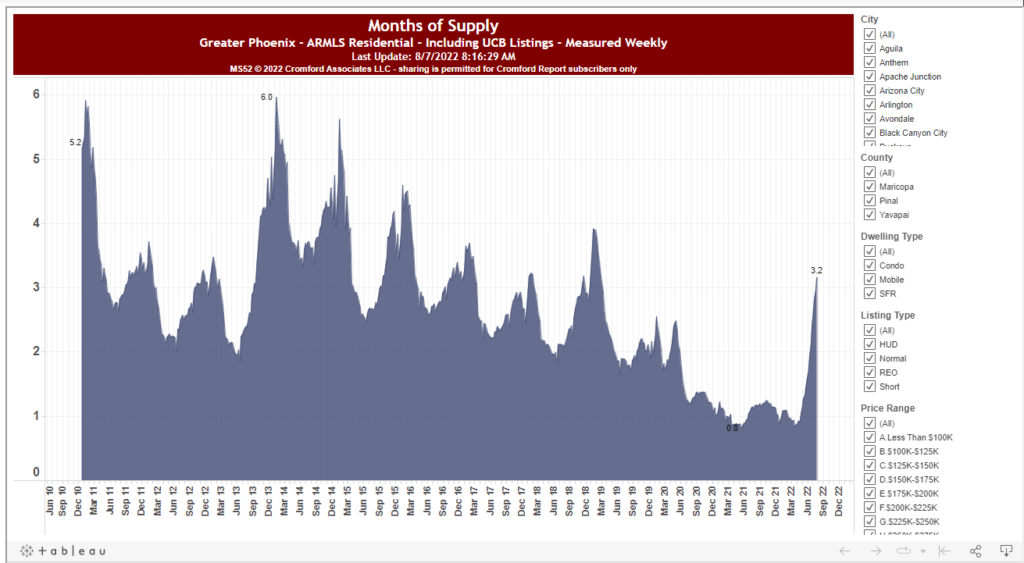
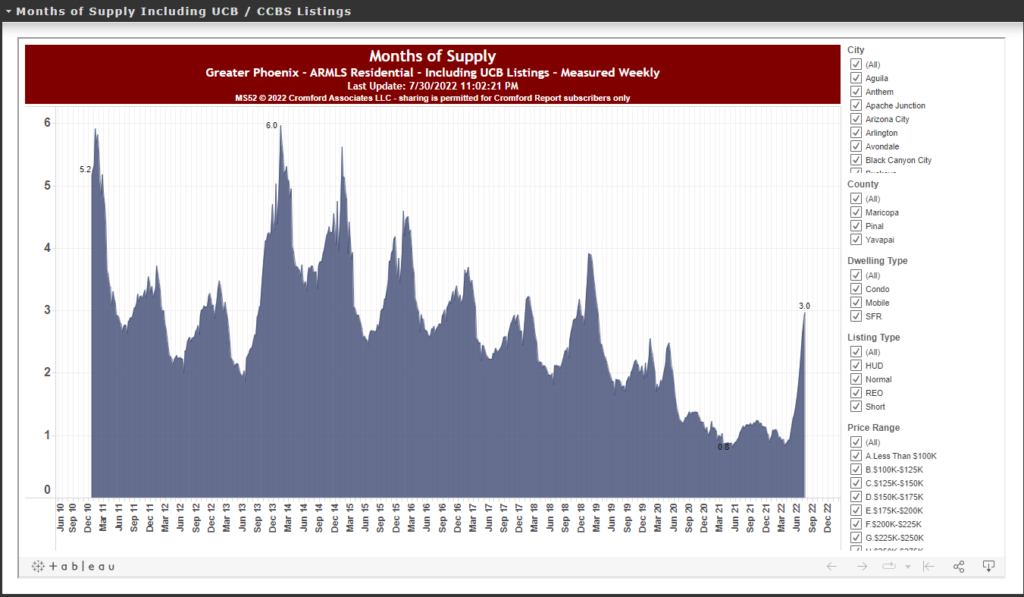
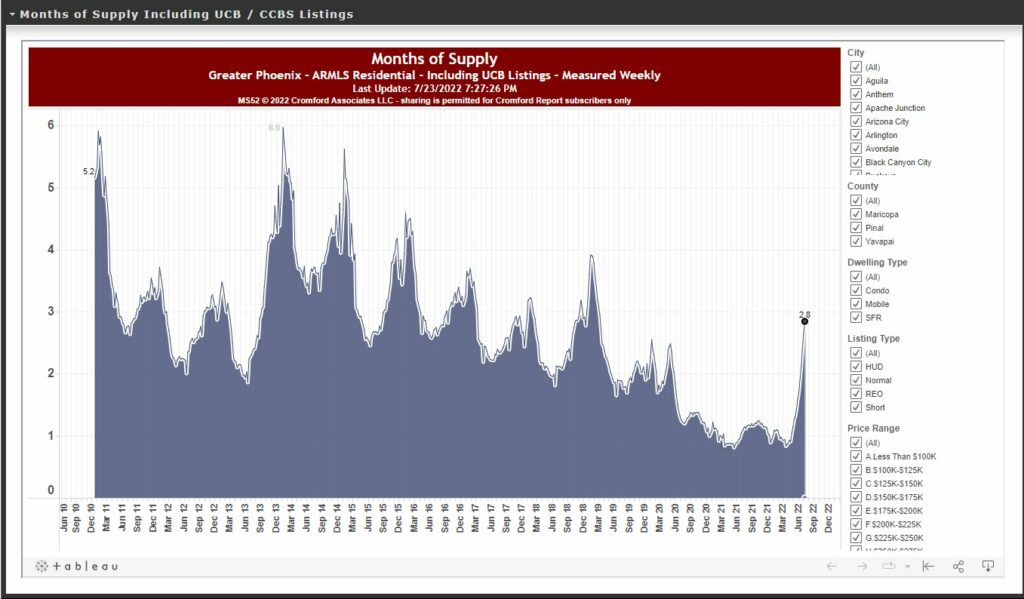
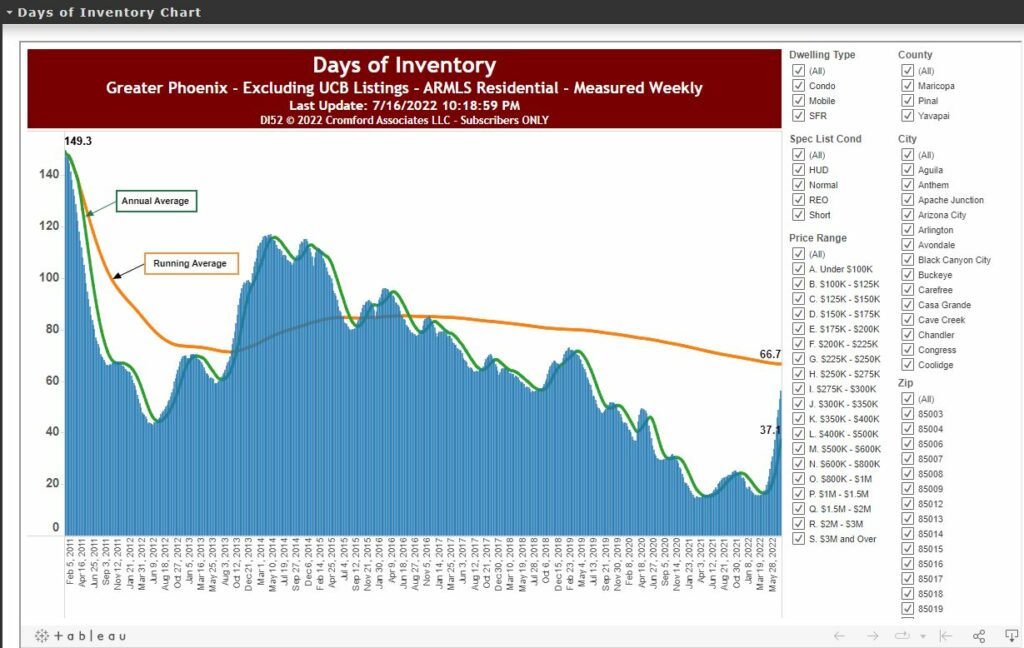
We have exactly 3 months of supply also going to put downward pressure on prices. The number I’m waiting for this to break is 3.9. Once this happens will have the most supply since 2016. I expect this will continue upward until Jan-Feb of ’23 (it’s cyclical).

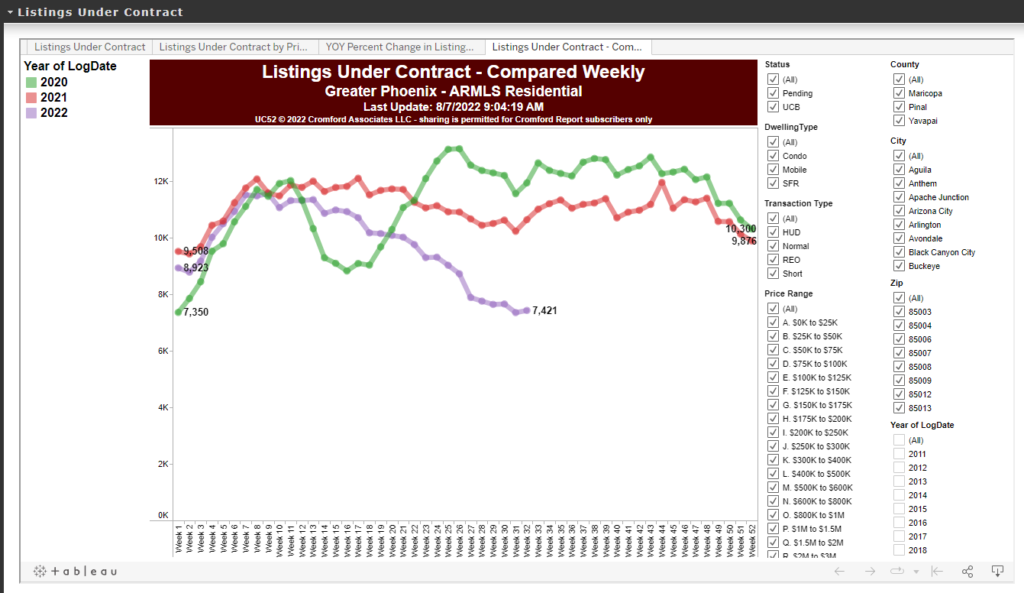
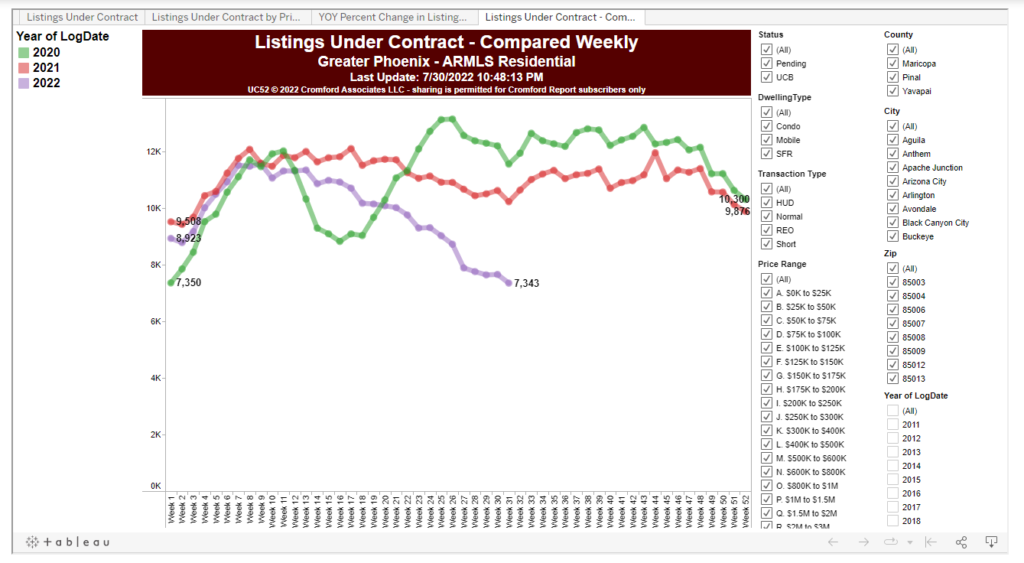
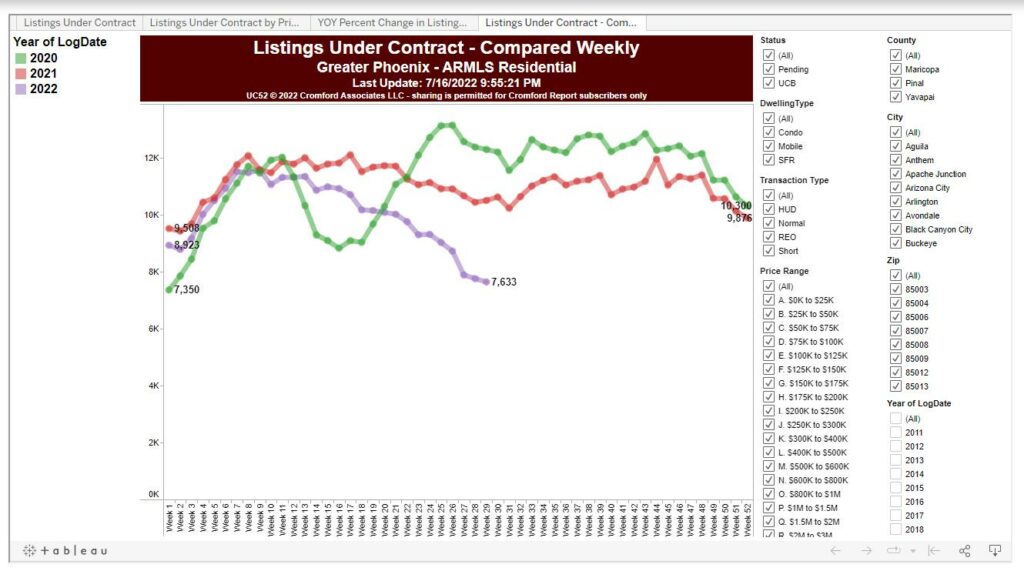
The number we should be watching now is listings under contract. It sits this week at 7,343. This is the lowest it’s been for at least 3 years. I don’t have data that goes back any further. This number will tell you where the ‘bottom’ is because it means people started buying again. Right now they still appear to be sitting on the sidelines.

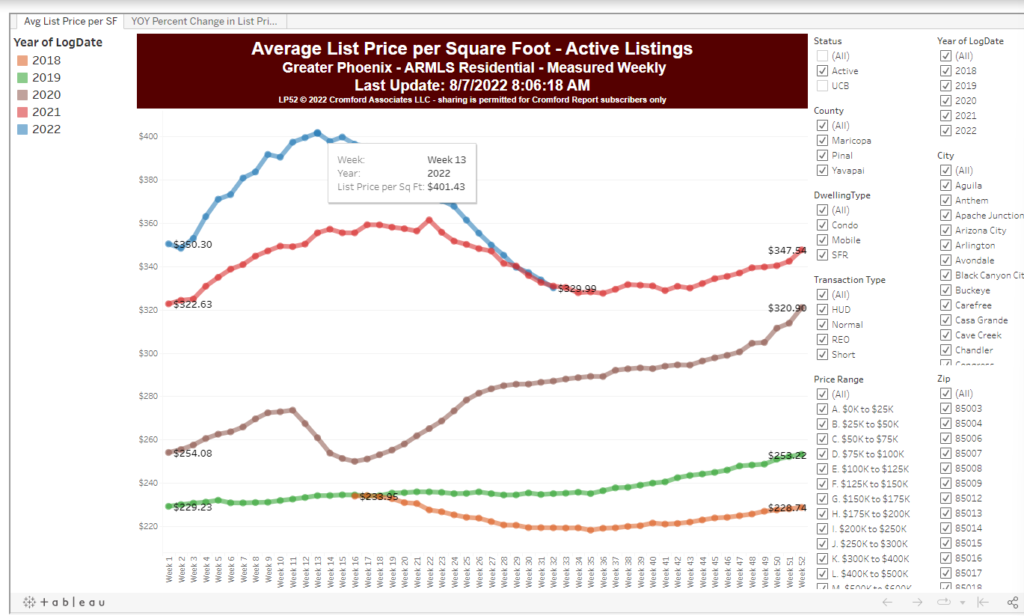
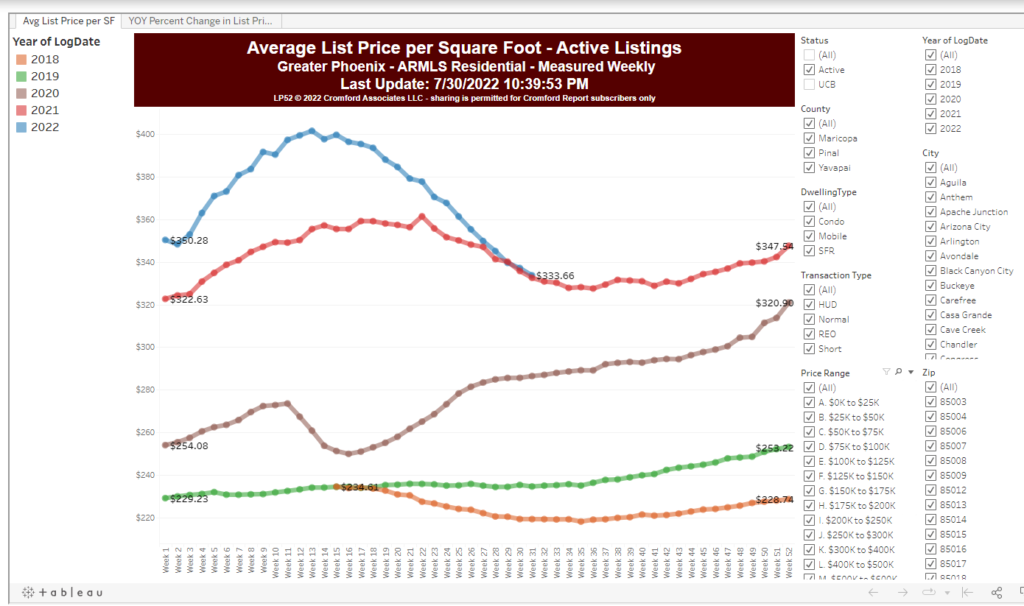
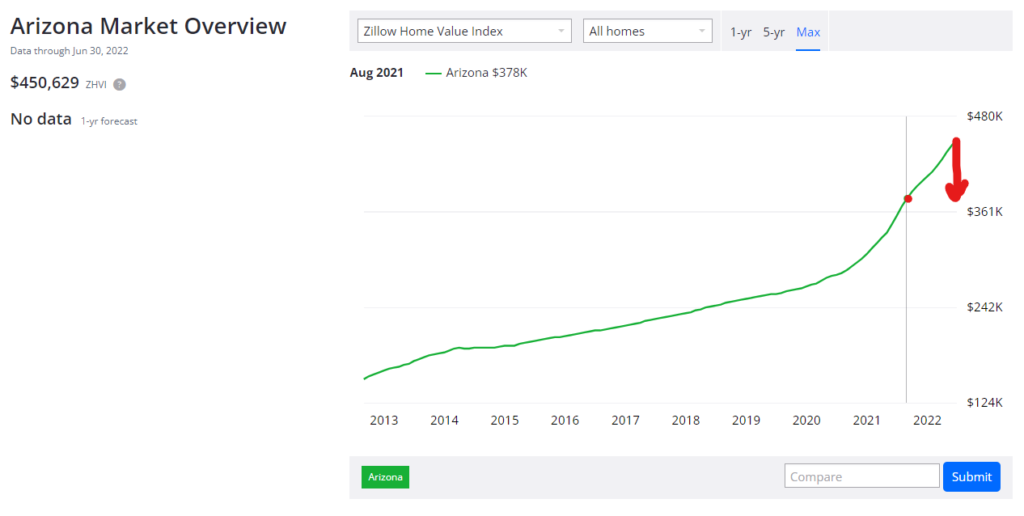
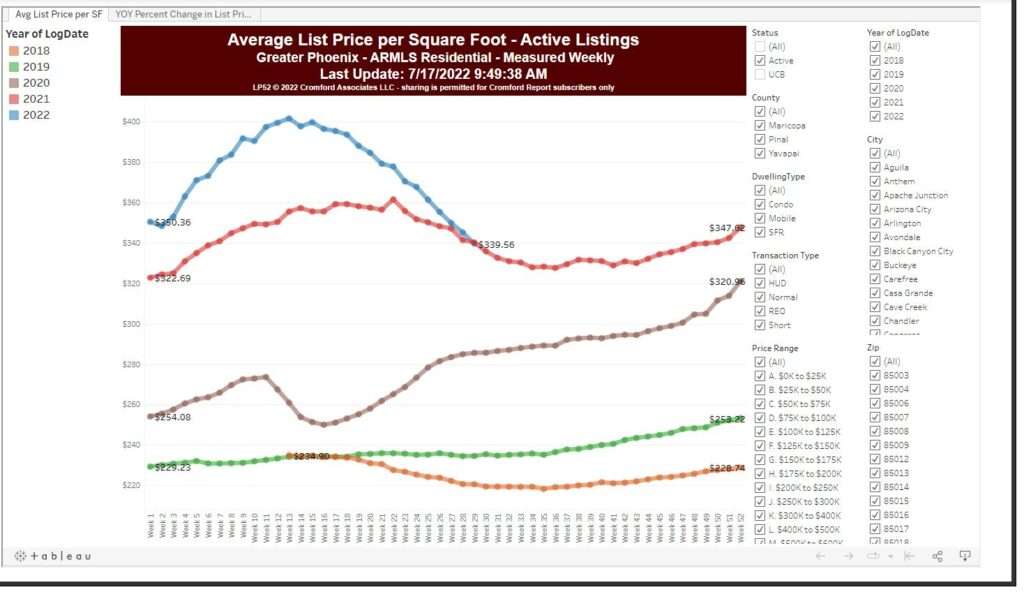
Listing prices are where they were a year ago. I’m not sure who is running things over at Zillow but their estimates don’t show any downturn. This appears to me to be highly inaccurate. I would not trust your ‘Zestimate’ right now. It seems their algorithm has no method to adjust for a ‘listing price’ variable.

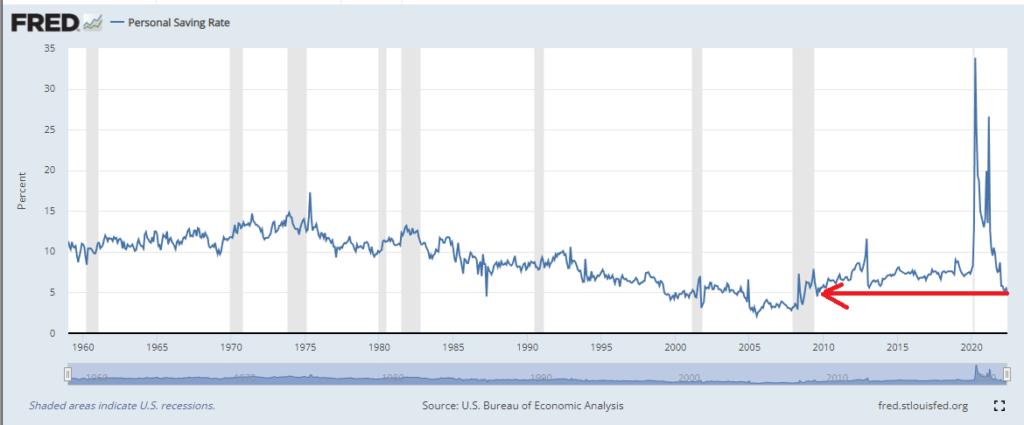
It’s understandable why houses are not moving. Since the huge injection of capital into the system in early 2020(Covid) people are broke again. This can be seen in the personal savings rate. It is the lowest since 2009. I think this will also have an adverse effect on retail stocks. I’m willing to bet this will continue to decline to all-time lows in the next year or two. America is addicted to stimulus. With Fed rates going up the balance sheet of individuals is going to deteriorate.

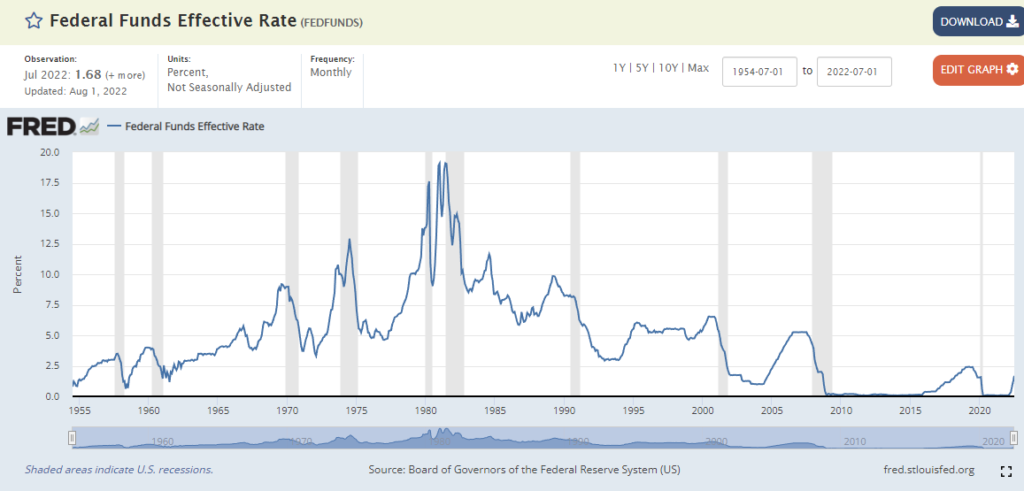
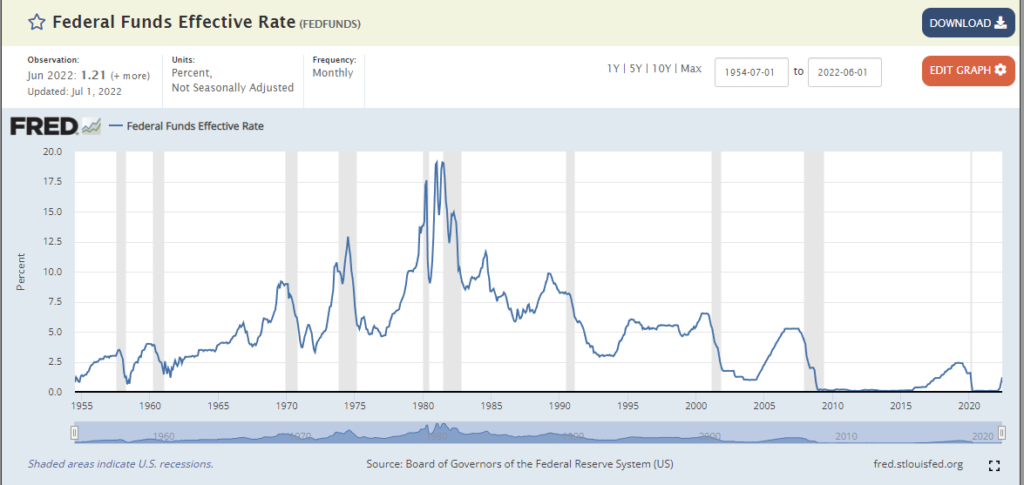
The question now is will the Fed continue to raise rates or pause as Powell hinted at last week?

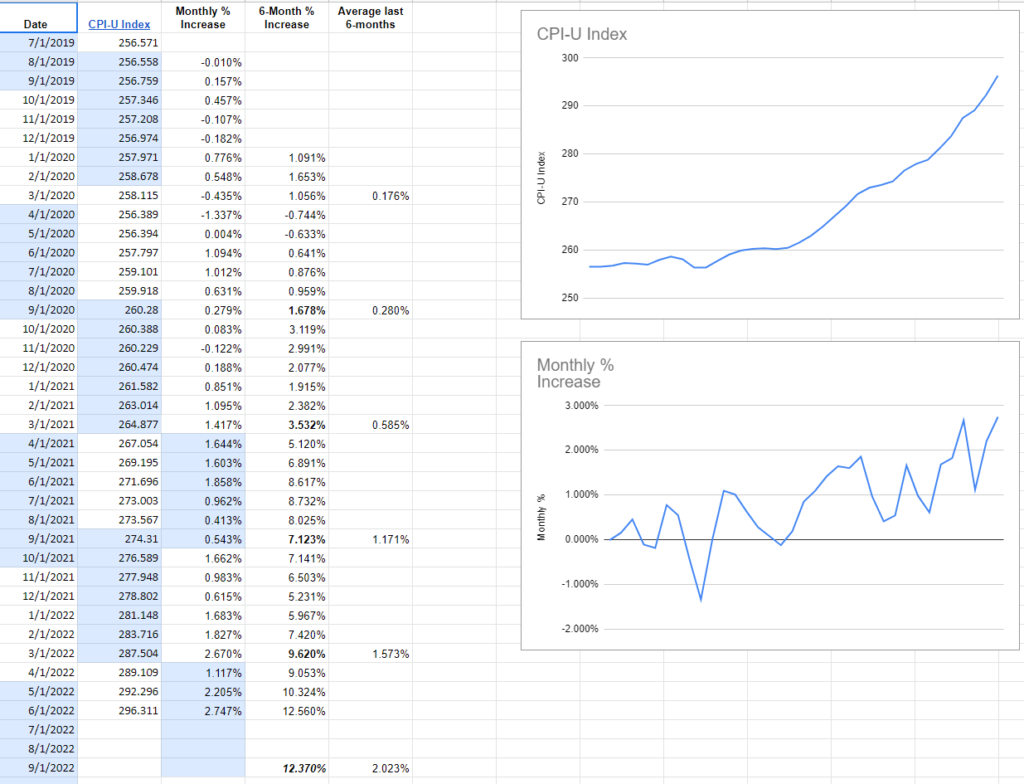
I’m a huge believer in I Bonds right now. They are one of the most solid investments you can make. They yield 9.62% risk-free. That being said I follow the inflation numbers pretty closely so I can determine what their new rate will be, come November 1st. There is nothing that indicates a slowdown in CPI-U(inflation). The next report is due on August 10th. I imagine that one won’t be friendly and the Fed will be back on track to raise rates for their September meeting. If inflation continues on its current trajectory then I bonds will yield north of 12% in November.

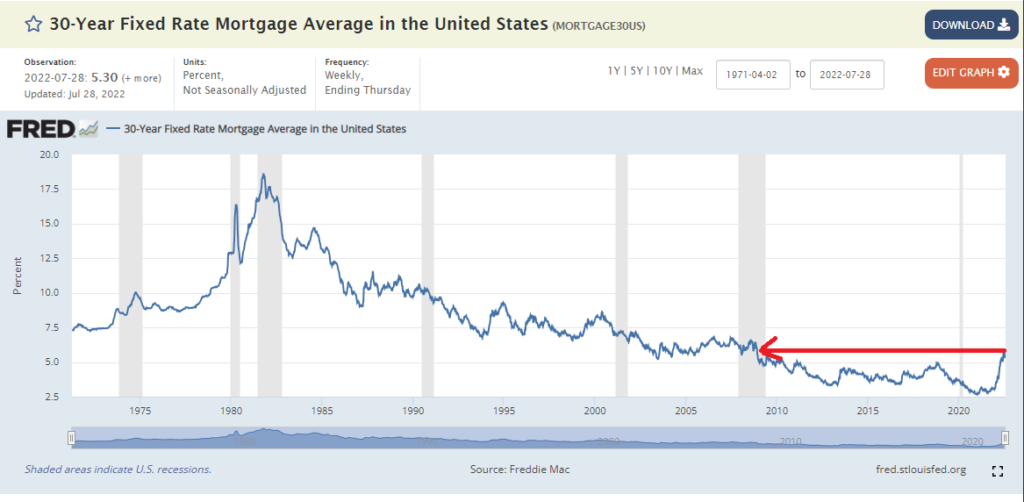
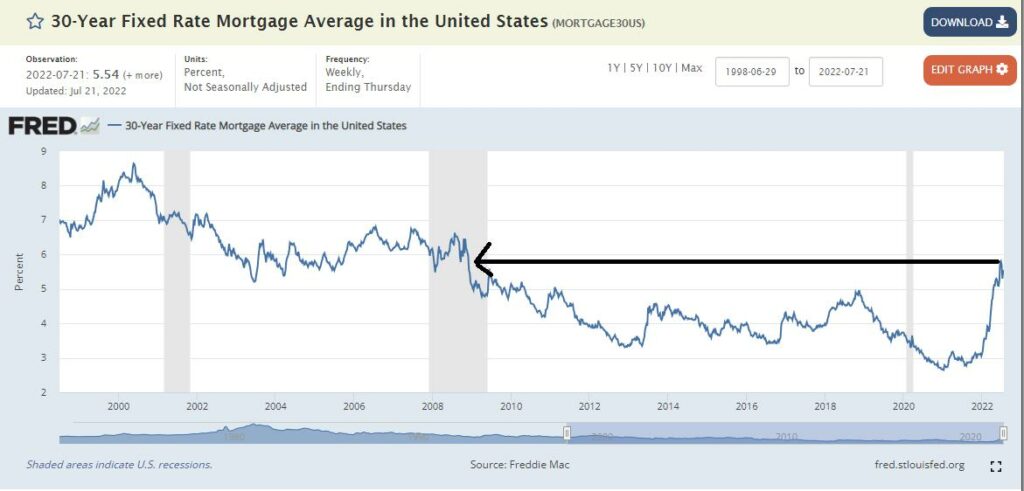
Mortgage rates are also where they were back in 2008/2009. With housing values up and rates up people cannot afford this market.

Arizona real estate weekly update 7.25.22

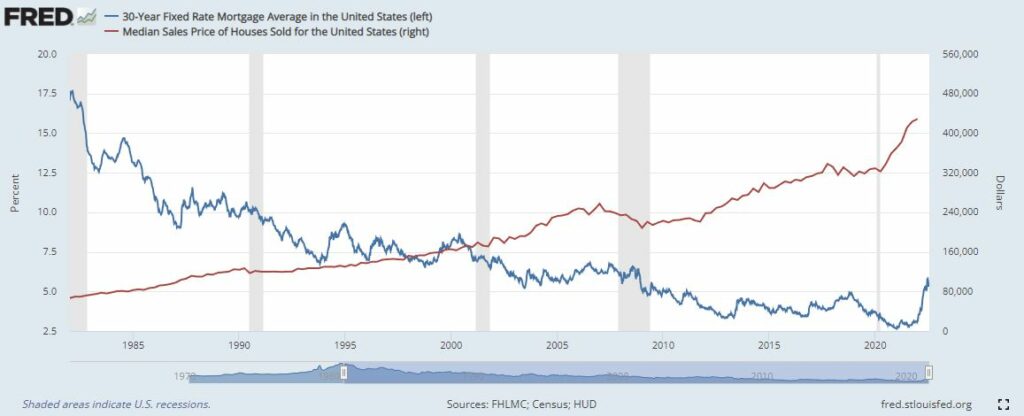
Call me crazy…But I believe affordability is the primary driver of housing prices. Mortgage rates determine payment. And payment determines affordability. This is rough rough rough math. But based on the inverse correlation between rates and housing prices you could easily derive from this chart a 30% drop in prices everything else being equal.

Buyers are still slashing prices as indicated in ‘Number of Price Changes per Week’. As long as this stays high or continues to grow there will be tremendous pressure continuing to push prices lower. Just because of psychological reasons if not anything else.

Based on the ‘average list price per square foot’ if you bought in the last year you are more than likely upside down. And technically you’re probably upside down if you bought anywhere near the end of 2020. Assuming a 6% reduction in your appreciation for selling fees.

Supply now sits at 2.8 months. This typically peaks in Jan-Feb. So I think it will continue to climb. I wouldn’t be surprised if we’re back to supplies being where they were in 2015 before it peaks, Jan/Feb ’23.

Arizona real estate weekly update 7.18.22

Price cuts continue to accelerate. Sellers are panicking. Typical at the top of a bull run. This is not good for housing prices.

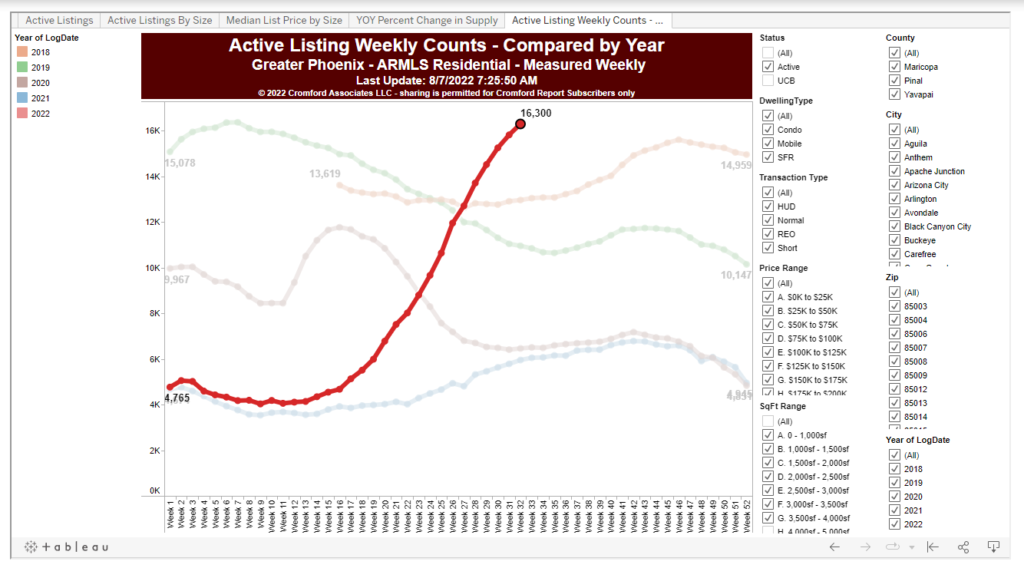
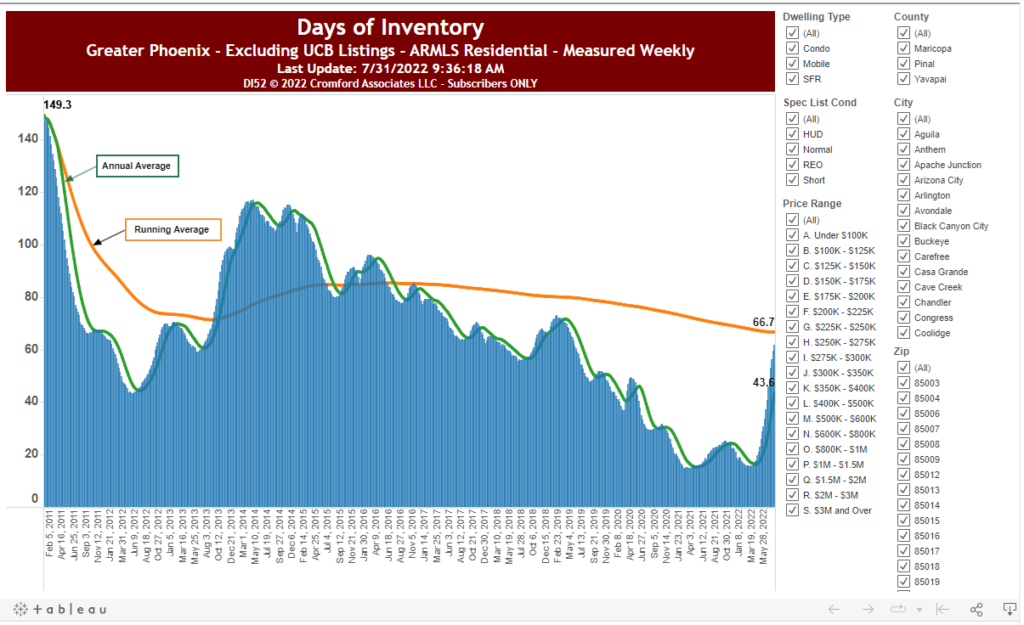
Inventory and months of supply are back to Jun 2019 levels.

Albeit minimal the price per square foot is now lower than where it was a year ago meaning the one year ROI on a house is negative for the first time since… Um, well, I don’t know. None of the data shows house prices to have ever declined in the last 4 years. This is major sign the market has turned.

Despite the ‘low prices’ the listings under contract are the lowest they’ve been in 3 years. Also, a sign that buyers are telling sellers to keep their houses.

Don’t buy yet. But have your gunpowder ready. There will be deals soon. Don’t try to catch a falling knife.

I Bonds don’t yield 9.62% – It’s actually 10.49%

The publicly advertised rate for I Bonds according to the Treasury Direct website is 9.62% if they were or are purchased between May and October of 2022.

But what people do not realize is that an I Bond issue month is the same regardless if you purchase it on the first day of the month or the last day of the month. So consider this, if you purchase an I Bond on July 31st of 2022 or in 18 days. Then on August 1st it is already 1 month matured.

So let’s do some basic math. If the current yield is 9.62% then you can divide this by 11. Given that you’re yielding 9.62% in 11 months, not 12. Or technically 11 months and 1 day. This will give you a monthly yield of .8745%. Multiply this by 12 and your annual yield is actually 10.49%