
Almost everyone in the United States who owns a home has seen a massive increase in the equity of their house. In the Phoenix metro area, we have seen massive gains. For instance, a house I purchased 1-year ago has seen around a 50% increase in value. Today I was discussing with a friend his options for protecting his equity shorting housing stocks rather than selling his primary residence.
Let’s take a look at the Case-Shiller and Zillow estimates for our local Phoenix market.
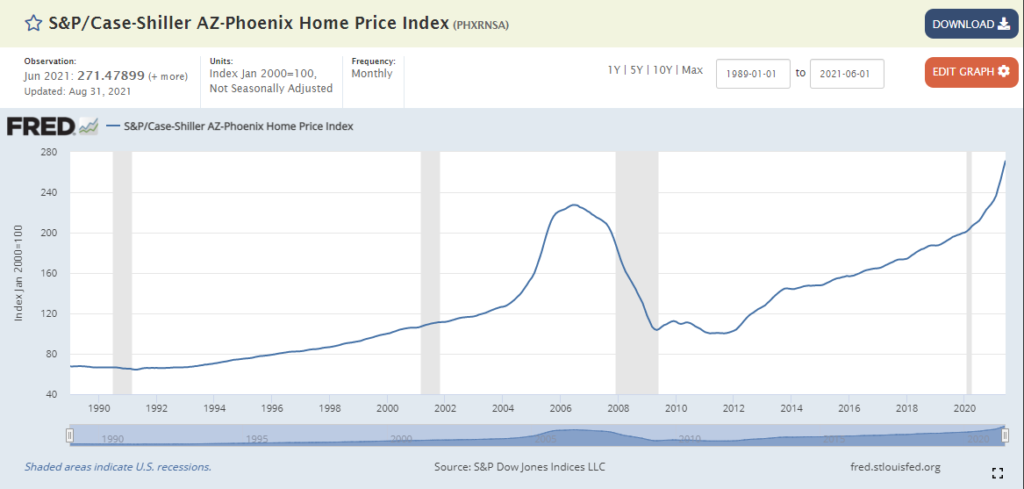
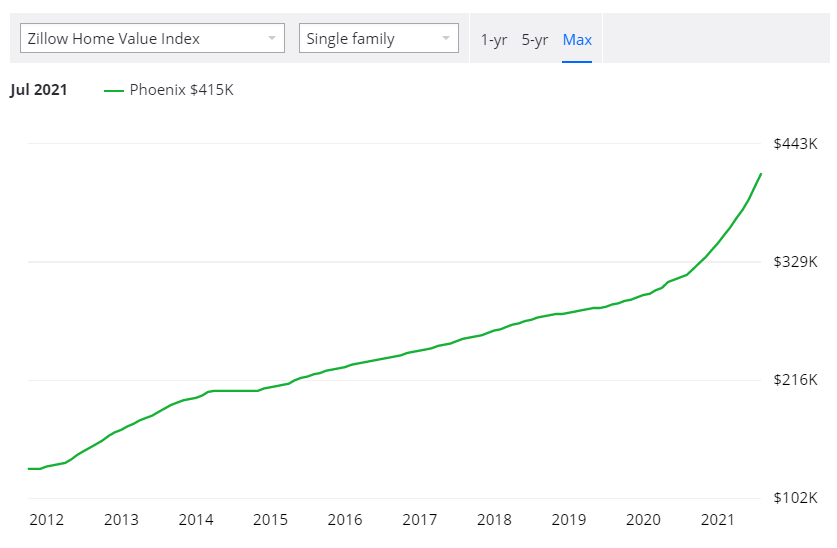
Phoenix has been one of the hottest real estate markets over the last few years. In addition, we have seen a huge population increase in Arizona.
2020 Population | 2010 Population | + People | + % | |
|---|---|---|---|---|
| Utah | 3,271,616 | 2,763,885 | 507,731 | 18.4 |
| Idaho | 1,839,106 | 1,567,582 | 271,524 | 17.3 |
| Texas | 29,145,505 | 25,145,561 | 3,999,944 | 15.9 |
| North Dakota | 779,094 | 672,591 | 106,503 | 15.8 |
| Nevada | 3,104,614 | 2,700,551 | 404,063 | 15 |
| Colorado | 5,773,714 | 5,029,196 | 744,518 | 14.8 |
| District of Columbia | 689,545 | 601,723 | 87,822 | 14.6 |
| Florida | 21,538,187 | 18,801,310 | 2,736,877 | 14.6 |
| Washington | 7,705,281 | 6,724,540 | 980,741 | 14.6 |
| Arizona | 7,151,502 | 6,392,017 | 759,485 | 11.9 |
| South Carolina | 5,118,425 | 4,625,364 | 493,061 | 10.7 |
| Georgia | 10,711,908 | 9,687,653 | 1,024,255 | 10.6 |
| Oregon | 4,237,256 | 3,831,074 | 406,182 | 10.6 |
| Delaware | 989,948 | 897,934 | 92,014 | 10.2 |
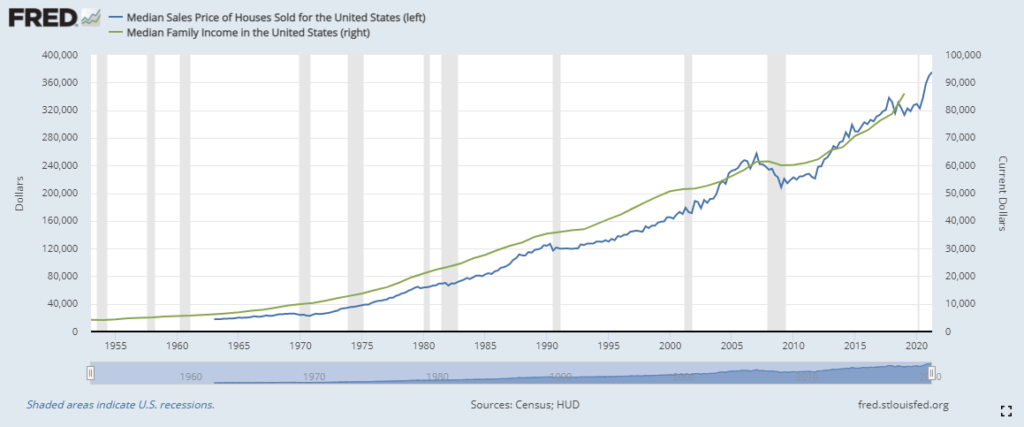
But are the prices high? I was to pause for a minute and look at the median sales price overlayed on the median family income. You have to normalize the price of a house. Given that people by houses a fair way to normalize this variable is to make it relative to the income of the average family or individual if you prefer.
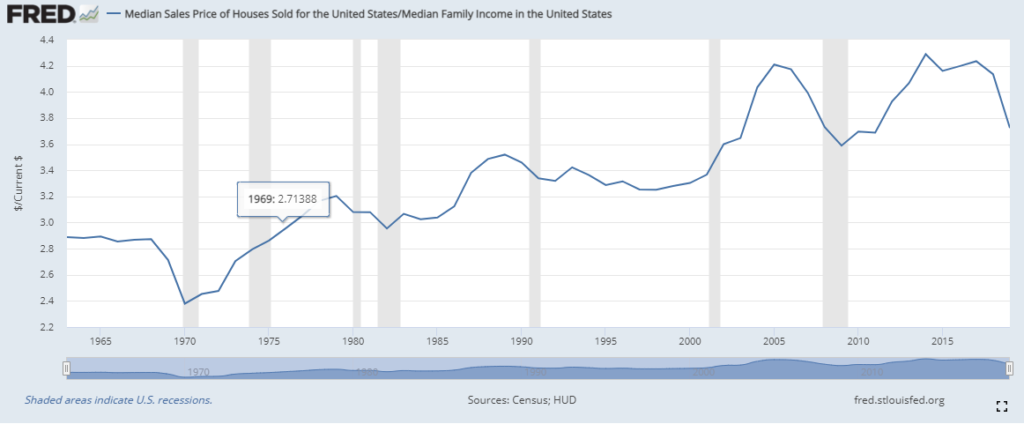
You can also use the median sales price of a house as the numerator and income as the denominator. This creates an oscillating indicator in which the peaks show the high price values and the troughs show the low price values. Do keep in mind this does not adjust for interest rates. This is a much more complicated formula so I won’t dive into this deeper. However, I do believe it is extremely relevant. Also, the data available on FRED isn’t updated to 2021 yet. So all of the appreciation we’ve seen in the last year or so is not accounted for in these charts. If I had to guess house prices are up significantly more than income.
I have heard a lot of people talk about selling their houses to capture the appreciation value because they “know” the prices will come back down. This is an extremely speculative comment but it’s one that I’ll entertain. In fact, I’ve thought about selling some houses as well. But know speculating with your primary residence is risky.
I want to outline some basic math here for anyone who is thinking about selling their house and the true cost. Let’s say you have a house that is now worth $400,000. You paid $200,000 initially. You now have $200,000 in equity. However, if you were to sell this house you’re looking at commissions for the buying and selling realtor plus miscellaneous fees. Let’s call this a total of 8%. It’s going to cost you roughly $32,000 to sell this house. Not to mention all of the other stress that comes with moving. This $32,000 represents almost 16% of your equity. You’re going to lose 16% of your equity if you make this move.
So let’s talk about creating a market-neutral position by short-selling residential construction companies in Arizona. I did not perform a comprehensive search for residential construction companies in Arizona. But I was able to pull up 6 publicly traded residential construction companies pretty quickly. Below you will find their 1-year return charts.
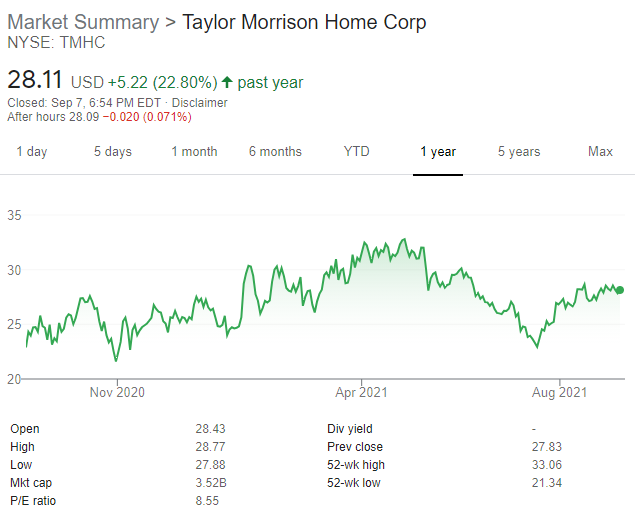
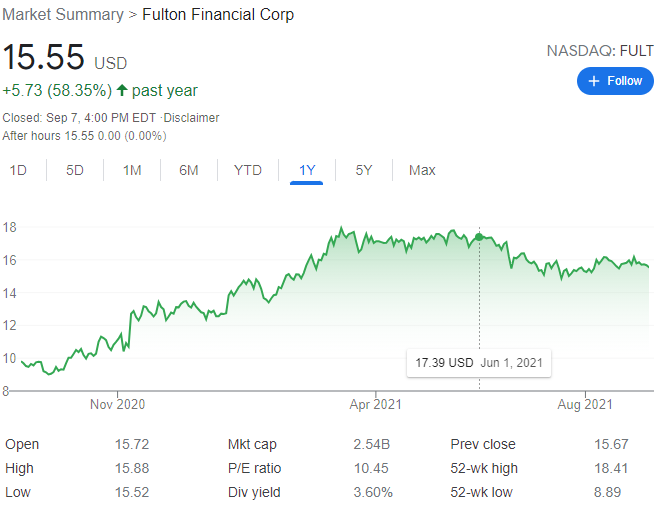
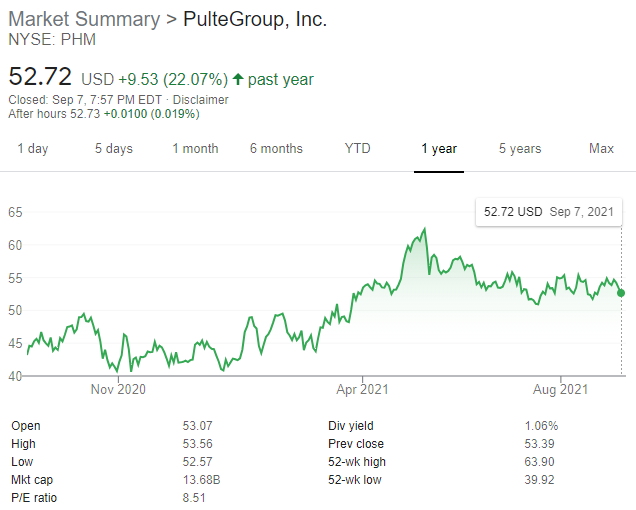
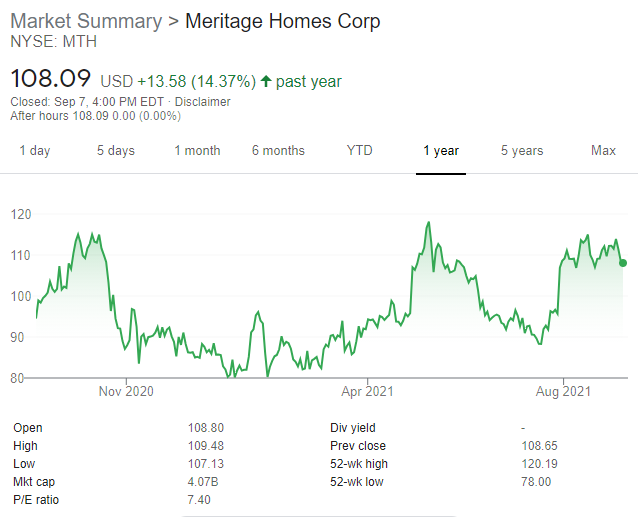
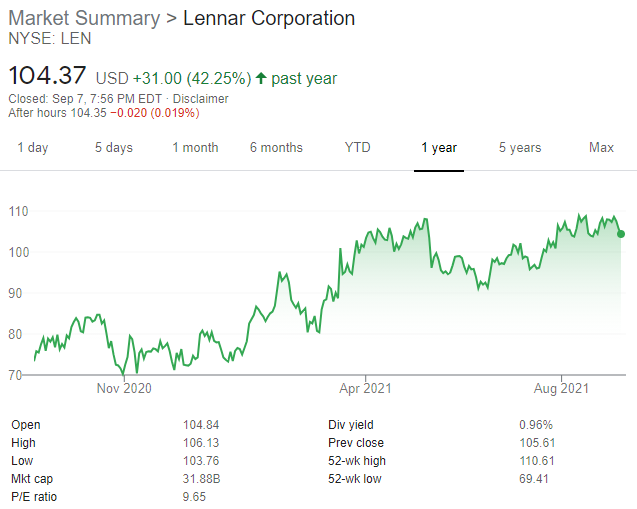
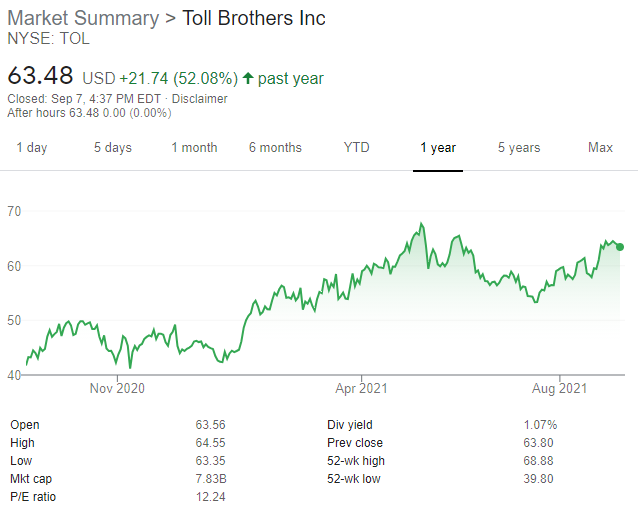
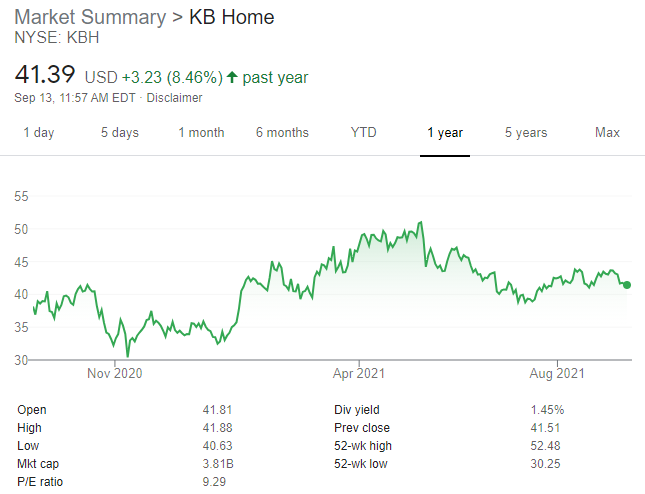
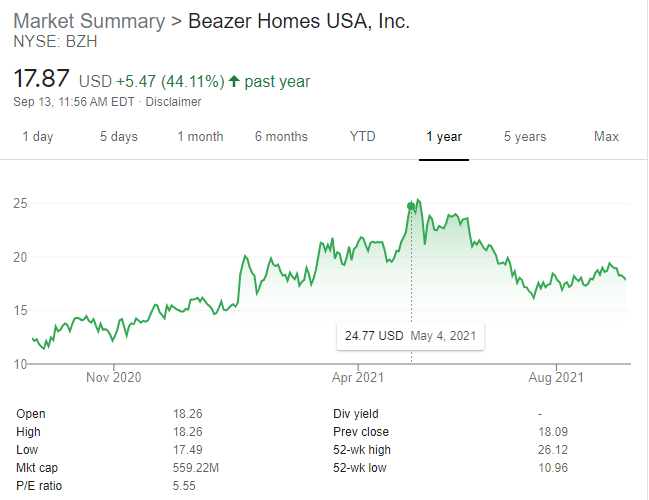
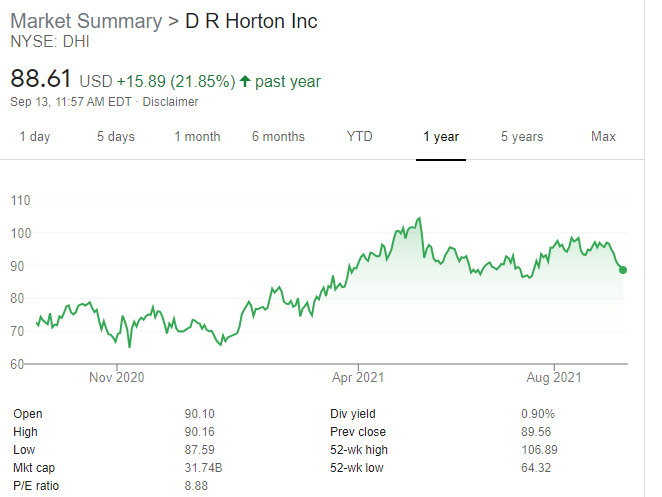
So let’s say you want to protect your $200,000 in equity as in the previous example. You could open short-sale positions in all of these stocks evenly. I highly recommended against short-selling one stock with any large percentage of your portfolio. The reason why is the downside loss is infinite. Short selling is extremely dangerous. The math for short selling these stocks is evenly balanced is pretty straightforward. You take your $200,000 and divide it by 6. This gives you $33,333 that you will want to short of each stock. You then take this number and divide it by the share price of the stock. In the last example, Toll Brothers is selling for $63.48. This would mean you would sell short 525 shares of this stock. So what we have essentially done here is make the determination that these stocks represent the value of house prices or that they have a high cointegration to house prices. Therefore if the housing prices go up you will lose money on your short and gain money on your house’s equity. Likewise, if housing prices go down you will make money on your short and lose money on your house’s equity. This puts you in what is called a market-neutral position. This occurs when you find highly cointegrated assets and place trades in opposite directions. Inherently you are long your house because you own it. So what we’re trying to accomplish is a short position equal to the value of your house. Or equal to the value of your equity.
There are also a few other techniques that I will not go into in this article.
- I would recommend analyzing the short interest ratio of the stocks you plan on shorting. This is the open short interest divided by the daily trading volume.
- Resaearch out of the money put options. This is a much cheaper way to make this bet with a limited downside risk. But options require a lot of effort and research.
- Instead of short selling specific stocks you can short sell the entire residential construction industry through different ETFs like XHB, HOMZ, or PKB.