You house isn’t worth what you think it is.

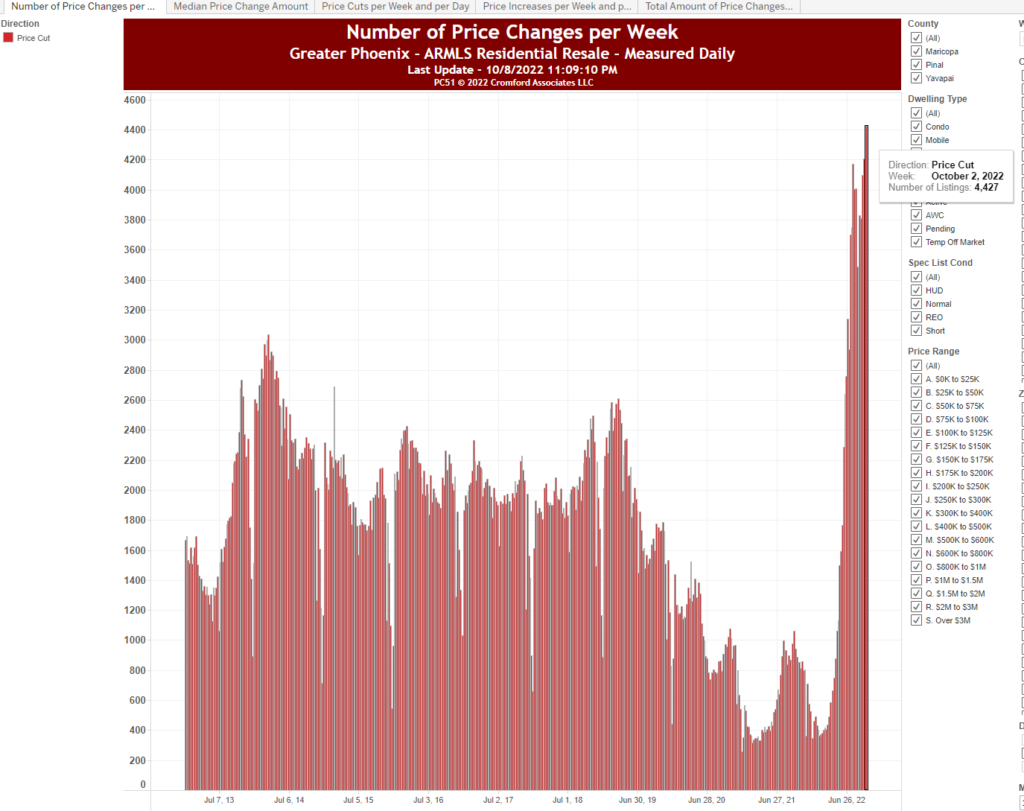
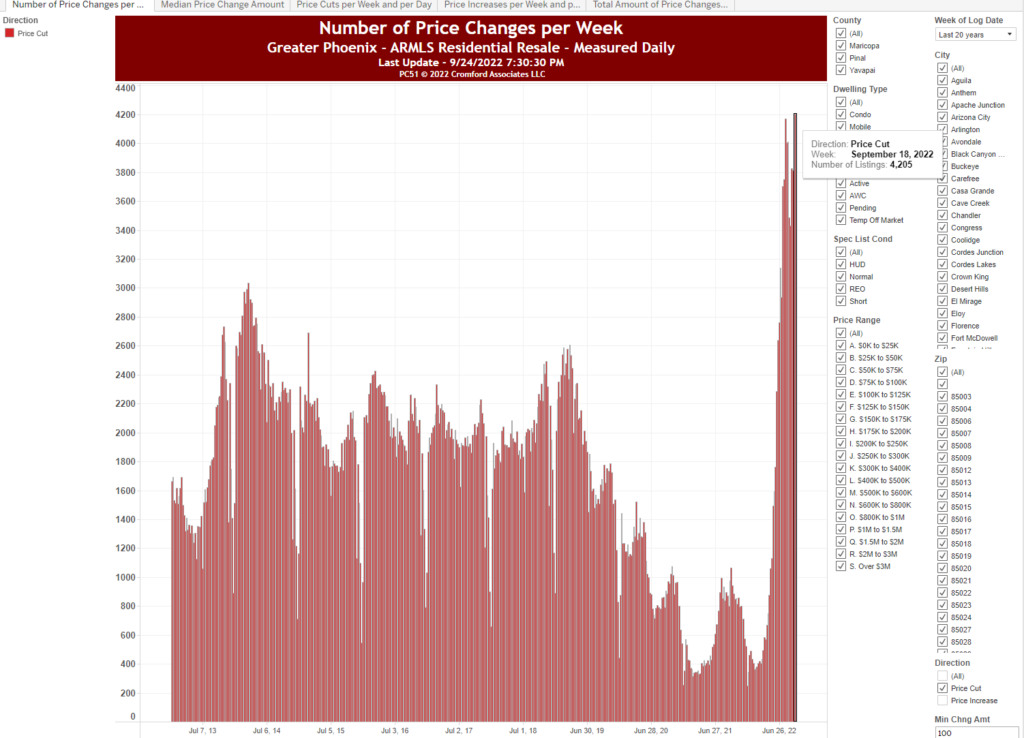
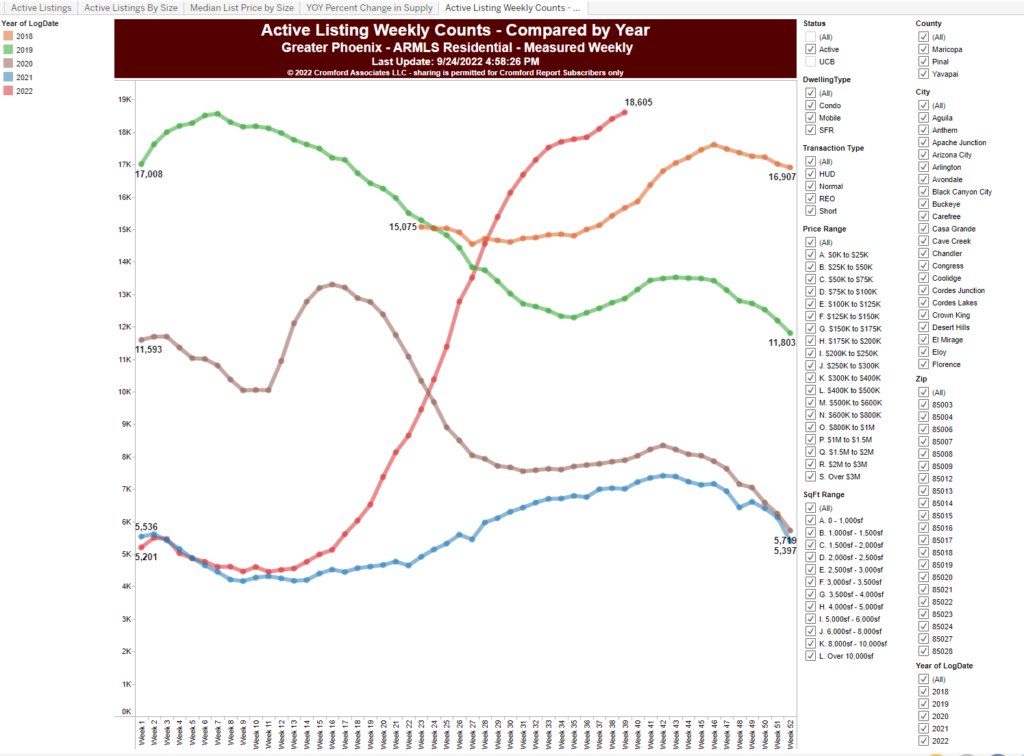
As I look over the real estate numbers in Arizona this week, I noticed that people are asking on average about 15% more than what houses sell for. In fact, we had 4,427 price cuts last week alone. This is 23% of the 19,225 houses available for sale.

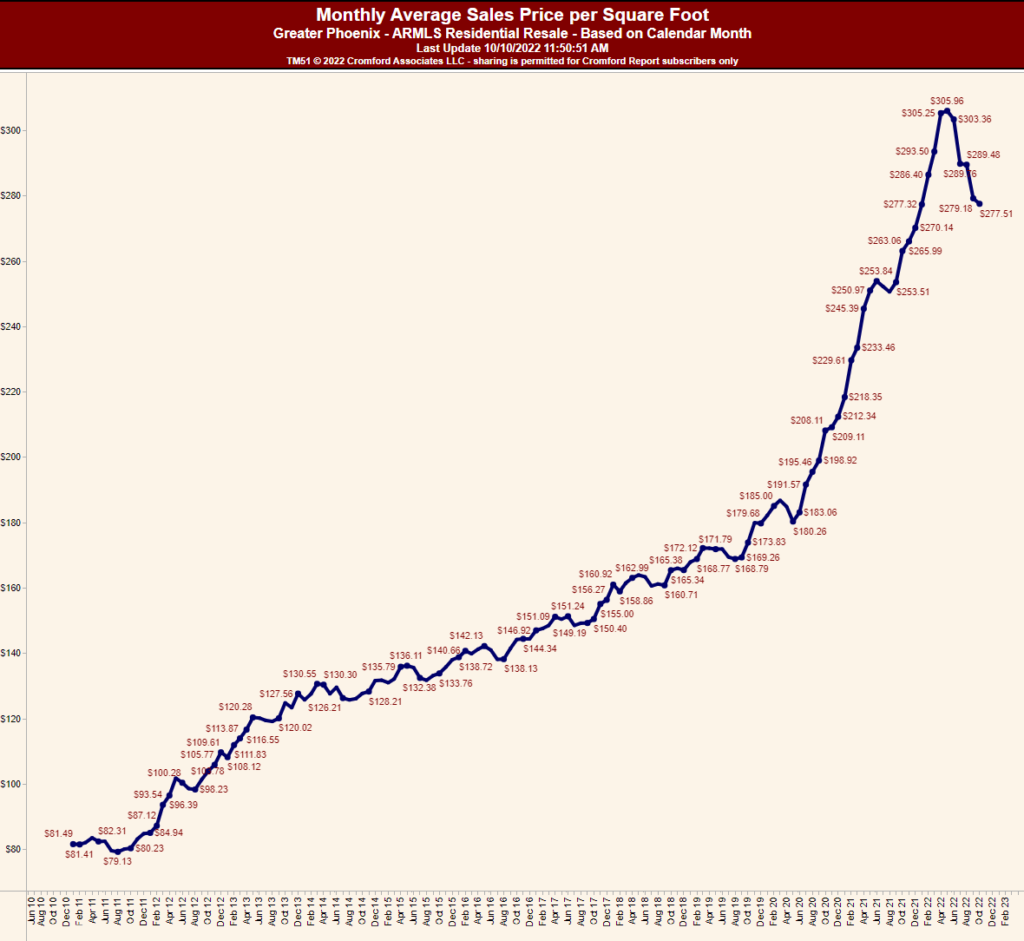
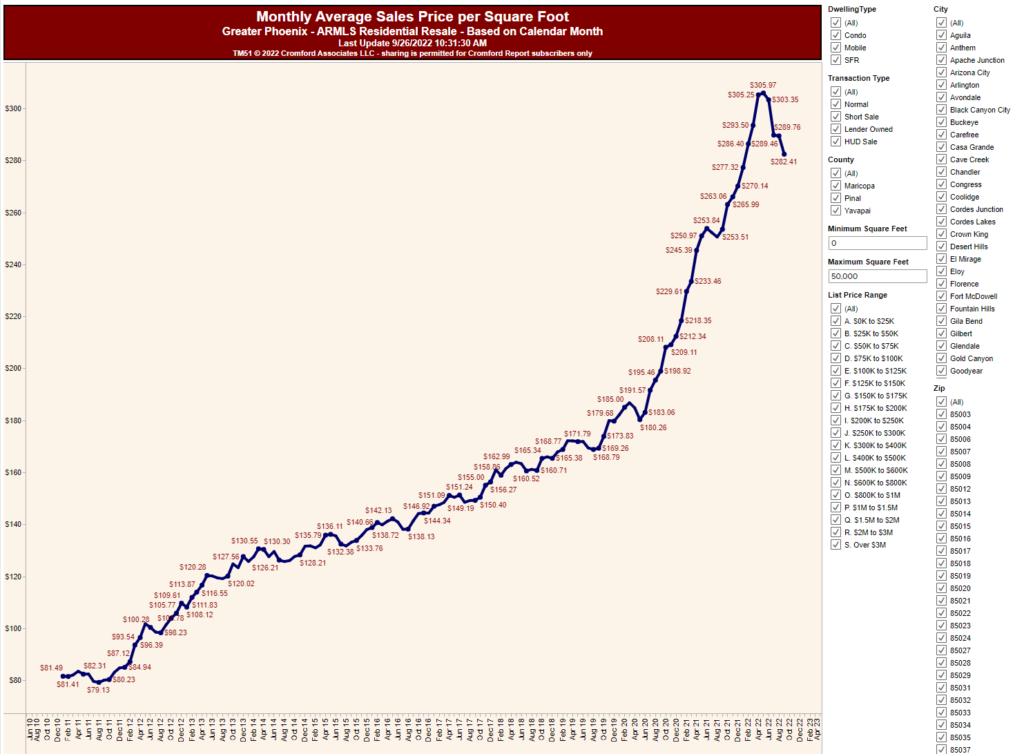
You can see from the average sales price houses are selling for $277.51 they peaked in May at $305.96. So they are currently 9.3% off from their high.

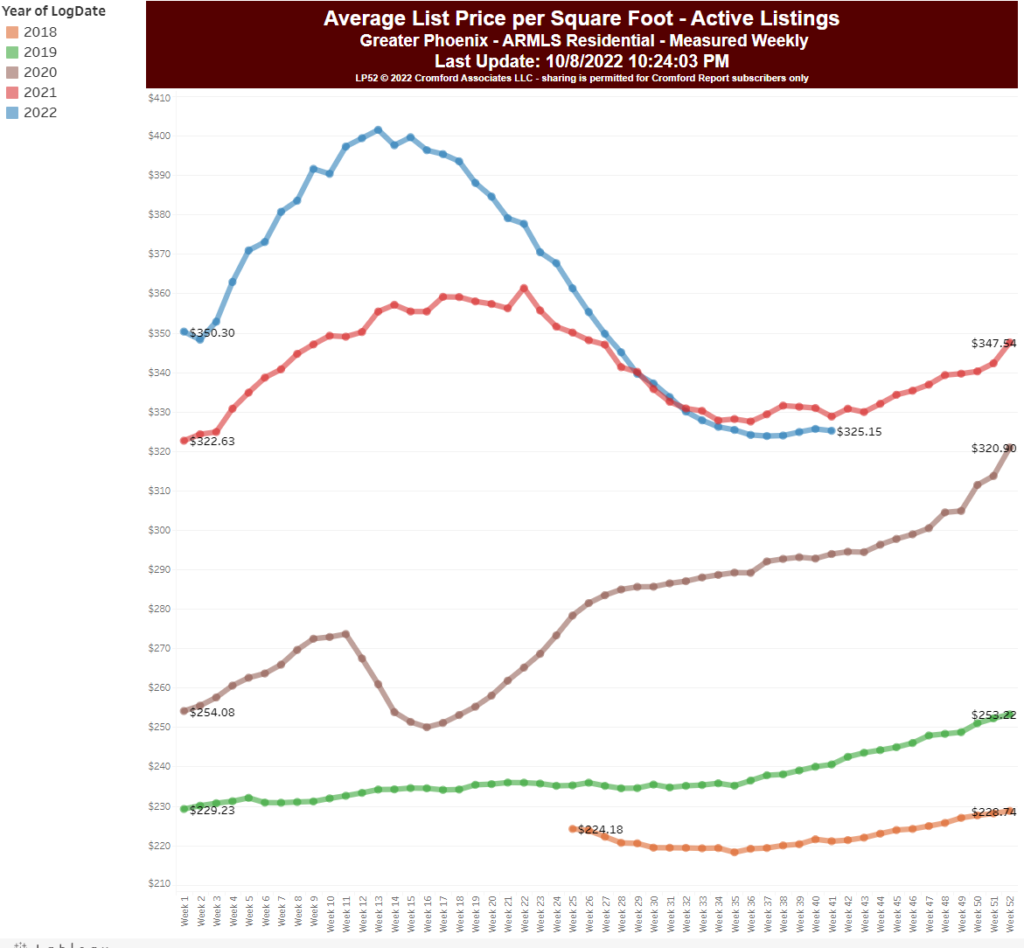
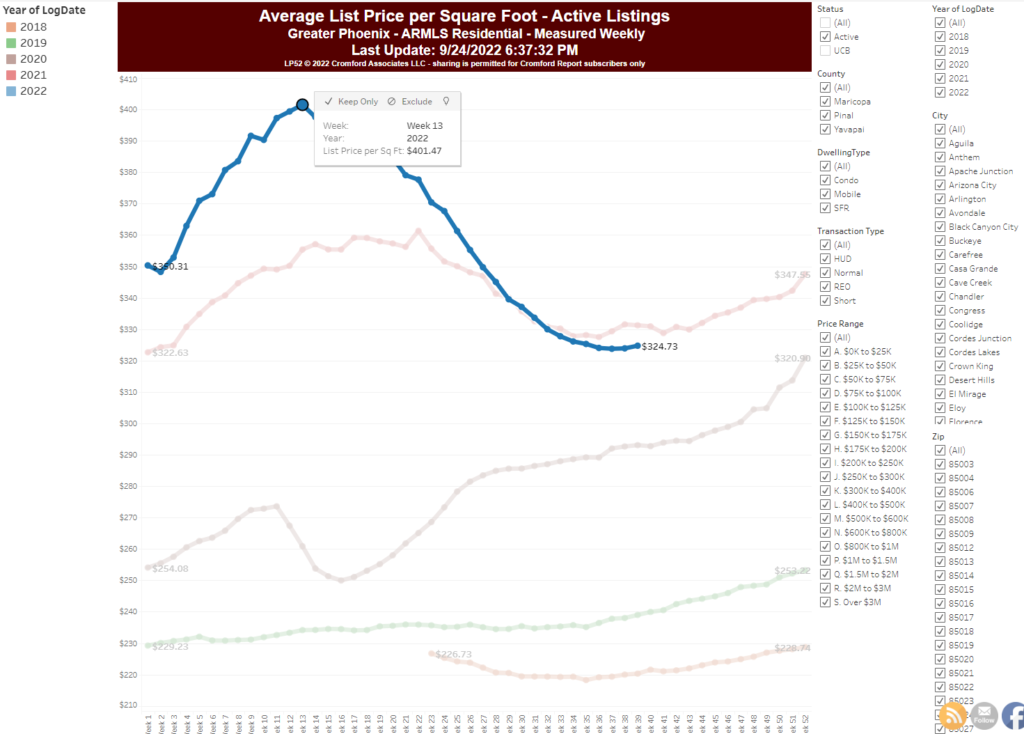
Now here goes the issue. The average price people are listing their house for sale for is $325.15 or about 14.7% too high.

So what do they do? They slash prices. 23% of house prices were cut last week alone. This leads to the next problem. Buyers now know the sellers are “desperate” or at least willing to reduce their price. So they no longer want to pay the asking price. They know they can offer less. This is why we will continue to see prices going down and inventory going up. So there is the main driver of low prices, the FED raising rates, and the secondary driver, psychology.

To confirm you can see the listing success rate is plummeting. It is now back to levels we have not seen since 2010.

Listing Success Rate is the percentage of listings that closed with a sale rather than expiring or being canceled. It compares the number of listings sold This Month with the number of listings that were sold, expired or canceled in the same period. This percentage gives a useful indication of what percentage of terminated listings closed successfully.

House prices may have peaked in May but mortgage payments are still at all time highs

The real estate market continues to get wrecked by the FED rate increases. From a valuation perspective. But most people I would argue don’t care about the price of a house as much as they do about the monthly payment. This is a combination of price and interest rate. So I wanted to create a dataset that shows the average house price with the median sales price. This will tell you what the average person’s monthly mortgage payment is.

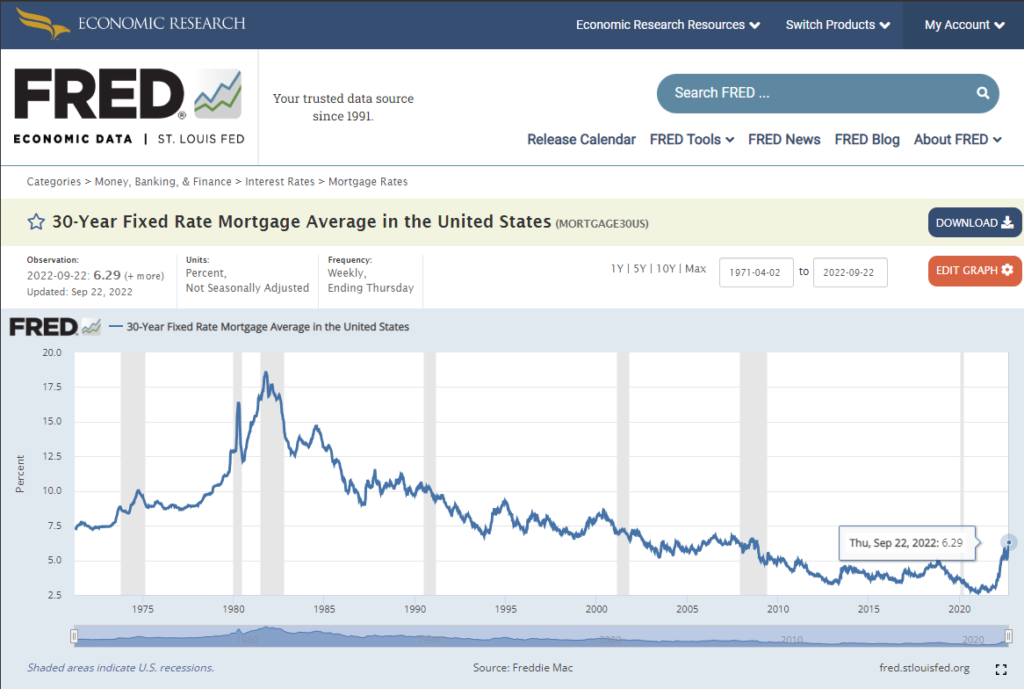
So here goes. The current average 30-year mortgage rate is 6.29% as of September 22, 2022.

We can take that and use Google Sheet’s formula to determine the monthly payment. It looks like this.

=-PMT(INT RATE/12,30*12,SALES PRICE)

I’m assuming zero down payment simply to hold this variable constant. What you can see here is the monthly payment currently is $2,728. This actually tops June’s monthly payment of $2,714. This means monthly mortgage payments adjusted for increased interest rates have not actually fallen at all. They are at their highest level ever.

This data is for Arizona specifically.

So while house prices are actually down 20% from their $480,000 median peak. Mortgages are actually higher.

The entire dataset, worksheet, and formulas can be found here.

So where do I think prices go from here?

If you look at the current 1-year average in mortgage payments the amount is $2,353. If we reverse the equation we used above with current rates then houses would need to be $381,00 just to revert back to the 1-year mean. This would mean we would need a 13.6% drop from this month’s current median sales price of $441,125 or a 20% drop from the peak price of $480,000 in May. Remember this is simply to get back to the 1-year average mortgage payment price. Market’s oversell and overshoot to the downside. The psychology of sellers with over 4,000 price cuts a week could mean things will get brutal.

Arizona Real Estate update 8.8.2022

Price cuts last week just went to their highest level in years. This is a horrible sign for things to come in Arizona. But it gets worse…

Active weekly listings are also at their highest level in years. In 2019 there were 18,562 houses for sale. We now exceeded that with 18,605 last week. Meaning there is a huge supply.

We are now 8% off the peak average sales price of $305.97/sq ft. Last week’s average sales price sat at $282.41/sq ft

What I think is more interesting is the average weekly list price is down 20% off its peak. Currently, it sits at $324.73/sq ft with the peak hitting $401.47. With the average sales price per sq ft at $282/sq ft and the average list price at $324/ sq ft there is a huge disconnect between people listing their houses for sale and what they are actually selling for. The average seller has to reduce their price by 13%. This is sure to get worse once the FED’s latest rate increases from last week take hold.

The listing success rate hasn’t been this low since 2014. Two more percentage points and we’re back to 2011 levels.

It appears a lot of sellers who “don’t need to sell” have just given up trying.

Arizona Real Estate update 8.8.2022

Six months ago some had the opinion, ‘this time is different. Their primary argument was that supply didn’t exist so housing prices could not fall that significantly. I always pushed back, you don’t know how many people are holding second or third houses as rentals. Or how many people bought Airbnb properties because ‘houses always go up in value? Well, now we are finally seeing people unload those houses. Where they came from for sure, who knows. But they are coming out of the woodwork. The good news is we are not yet back to the levels of inventory that we saw back ding the 2008 collapse. The peak houses for sale back then were somewhere just shy of 60k. All of the old data can be found on ARMLS. It would be nice if someone compiled it into graphs.

The months of supply now sit at 3.2. As I’ve indicated before supply is cyclical and we should see this peak around Jan-Feb, all else being equal.

House prices peaked at $401.43/sq ft in March. Since then they have declined about 18% to $329/ sq ft.

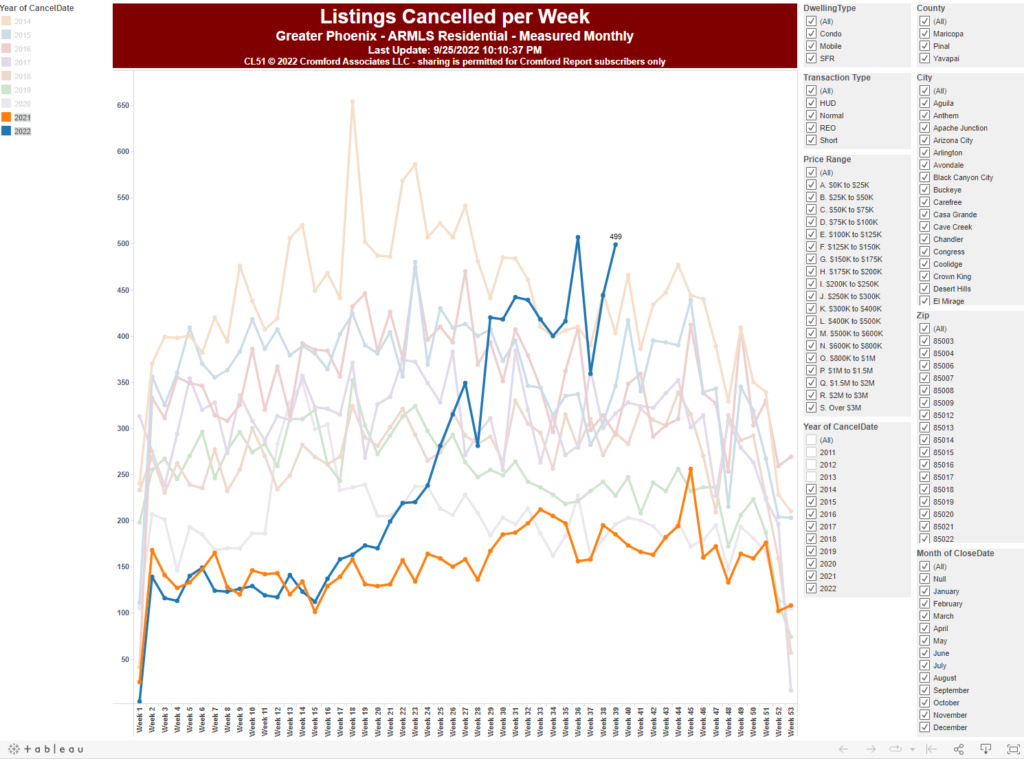
One of the key things I’m keeping an eye on is the number of price cuts per week.

It is still elevated at 4,006. This represents 25% of the listings for sale. One in every four people who are selling houses has had to cut their price in the last week. The psychological implications of this I think are huge. People are not going to buy if they think prices will continue to decline. Listings under contract continue to decline and currently sit at 7,421.

To put this in perspective in Q4 of 2007 the lowest this level dropped to was 8,898. You could however argue that this low number is due to low inventory.

I follow CPI(inflation) pretty closely for a different investment that I’m working on.

The FED is afraid of inflation. In fact, I think it’s the only thing keeping them in check. It is the main driver behind them raising rates and why they will continue to do so. I’m eagerly waiting for the July CPI report which will be released on August 10th. If CPI is continuing up the FED will respond accordingly. Until the FED stops raising rates I would be very cautious about investing in any asset class.