As the Federal Reserve recently bailed out the wealthy bankers once again, the Bank Term Funding (BTFP) has been pushing the Fed’s balance sheet up from $8,342T on March 8 to $8,733T on March 22. This bailout is supposedly a short-term lending program, but with the banks’ financial houses in disarray, one can’t help but be skeptical.
The goal here is to shed light on how six of the largest US banks, including Charles Schwab Corp. and PNC Financial Services Group Inc., used a simple accounting maneuver to shield billions of dollars of losses from their books. They changed the classification of over $500 billion of their bond investments to “held to maturity” from “available for sale,” effectively freezing the bonds’ values, no matter how far they fell in the market. But that isn’t the worse of it. The FED through BTFP has agreed to loan any bank money on the original value of these bonds.
This preferential treatment for bankers can be likened to an individual claiming they won’t sell their house any time soon(available for sale) but instead hold it forever(hold to maturity), insisting the Fed should give them a loan on the original purchase price even if it’s worth significantly less today. While the rest of us grapple with the consequences of Fed rate hikes aimed at curbing inflation, these bankers are granted special privileges, securing loans at rates unavailable to the general public. The glaring disparity raises the question of why the banking elite continues to enjoy such benefits, while the average person must bear the brunt of economic measures designed to slow inflation. The ongoing preferential treatment for the financial sector only serves to widen the gap between the wealthy and the rest, further entrenching social and economic disparities.
Let’s dig deeper into the numbers. These six banks had a combined $1.14 trillion balance-sheet value as of December 31, up from $681 billion a year earlier. This was primarily due to the reclassification of their bond investments. The $1.14 trillion figure was $118 billion (12%) higher than the bonds’ fair-market values. The $118 billion was equivalent to 18% of the banks’ total equity.
In 2021, the Fed’s peak balance sheet was $8,965T, and they forced the economic pain onto America and reduced it to $8,339T within a year. However, the recent bailout has undone a significant percentage of this reduction. The bailout increased the balance sheet from $8,342T on March 8 to $8,733T on March 22, representing an increase of $391.5B. This means that approximately 52.6% of the reduction within the last year has been wiped away in just two weeks!

It appears that the efforts to slow inflation are aimed primarily at the average person, while the bankers seem to be exempt from these measures. The disparity in treatment between the general public and the banking elite raises concerns about the fairness and effectiveness of the financial system, as the privileged few continue to enjoy benefits that are out of reach for most people.
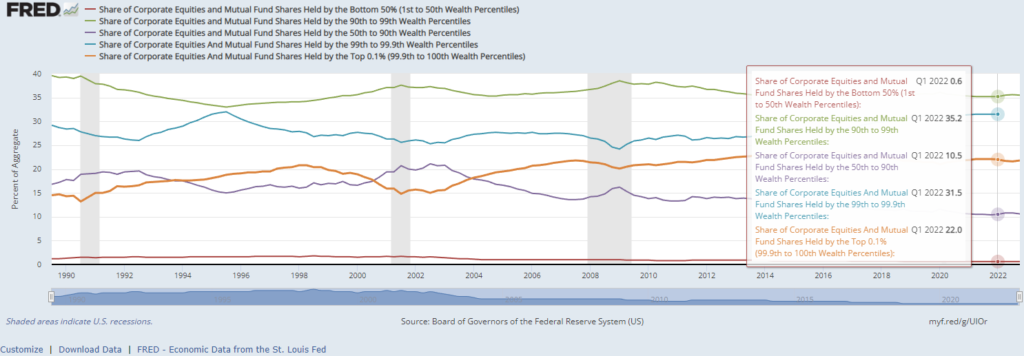
But there’s another issue. This bailout also props up equities values and who does that benefit? Not the poor people, not even the bottom 50 percentile. So make no mistake this propping up of all these banks is a punch in the gut to all the people suffering economically.
Here are the executive compensations from the banks’ annual reports in 2021(not updated):
- Charles Schwab Corp.
- Walter W. Bettinger II (President and CEO): Total Compensation – $17,145,128
- Joseph R. Martinetto (Senior EVP and COO): Total Compensation – $9,283,784
- Peter B. Crawford (EVP and CFO): Total Compensation – $6,238,985
- Jonathan M. Craig (EVP and General Counsel): Total Compensation – $5,197,254
- Christine R. Gaze (EVP and Chief Marketing Officer): Total Compensation – $5,007,660
- Timothy D. Heier (EVP and Chief Human Resources Officer): Total Compensation – $4,706,484
- Terri R. Kallsen (EVP and Head of Schwab Investor Services): Total Compensation – $4,520,833
- Jeffrey M. Carney (SVP and Head of Schwab Institutional): Total Compensation – $4,192,170
- PNC Financial Services Group Inc.
- William S. Demchak (Chairman and CEO): $16.5 million
- Robert Q. Reilly (Executive Vice President and CFO): $6.4 million
- E. William Parsley III (Vice Chairman and COO): $7.1 million
- Richard K. Bynum (Chief Corporate Responsibility Officer): $2.7 million
- Joseph Alvarado (Director): $278,160
- Debra A. Cafaro (Director): $414,330
- Linda R. Medler (Director): $367,510
- Andrew T. Feldstein (Director): $391,710
- Martin Pfinsgraff (Director): $364,670
- Daniel Hesse (Director): $363,550
- Michael J. Ward (Director): $361,170
- Charles E. Bunch (Director): $363,550
- William S. Parsley III (Director): $360,170
- Marjorie Rodgers Cheshire (Director): $354,070
- Steven C. Van Wyk (Director): $350,170
- U.S. Bancorp
- Andrew Cecere, Chairman, President and CEO: $12,190,230
- Terrance R. Dolan, Vice Chairman and CFO: $4,783,733
- Gunjan Kedia, Vice Chairman and Chief Strategy Officer: $5,527,326
- Mark J. Mulhern, Vice Chairman and Wealth Management & Investment Services: $4,386,123
- Jodi N. Richard, Vice Chairman and Chief Risk Officer: $4,715,903
- Christopher G. Van Gorder, Vice Chairman and Chief Risk Officer: $4,721,068
- Jeffery A. von Gillern, Vice Chairman and Chief Credit Officer: $3,864,515
- Ellen M. Zane, Vice Chairman and Independent Lead Director: $468,000
- Truist Financial Corp.
- Kelly S. King (Chairman and CEO): $15.5 million
- Daryl N. Bible (CFO): $6.9 million
- William H. Rogers Jr. (COO): $14.3 million
- Ellen M. Fitzsimmons (General Counsel): $5.5 million
- David H. Weaver (Chief Risk Officer): $4.4 million
- Brantley J. Standridge (Chief Data and Analytics Officer): $4.4 million
- W. Bennett Bradley (President of Banking): $4.2 million
- Clarke R. Starnes III (Chief Human Resources Officer): $3.5 million
- Dontá L. Wilson (Chief Digital and Client Experience Officer): $3.5 million
- Thomas E. Freeman (President of Truist Insurance Holdings): $2.9 million
- William J. Chivers Jr. (President of Wholesale Banking): $2.8 million
- Scott C. Case (President of Retail Community Bank): $2.6 million
- Cynthia B. Day (Chief Diversity and Inclusion Officer): $2.1 million
- Joseph K. Hannan (Chief Commercial Credit Officer): $2 million
- Steven A. Lerner (Chief Communications Officer): $1.8 million
- Wells Fargo & Co.
- Charles W. Scharf, CEO: $20.3 million
- Michael L. Santomassimo, CFO: $9 million
- Scott E. Powell, COO: $11.6 million
- Avid Modjtabai, Senior EVP: $9.8 million
- Lester Owens, Senior EVP: $7.6 million
- William M. Daley, Vice Chairman: $6.4 million
- Ellen Patterson, EVP: $6.2 million
- Jonathan G. Weiss, Senior EVP: $5.7 million
- Barry Sommers, CEO, Wealth & Investment Management: $5.5 million
- Michael DeVito, Senior EVP: $5.1 million
The bottom line is that the banking elite is benefiting from accounting maneuvers and bailouts that leave the average person footing the bill. While the BTFP is still in progress and its final size remains unknown, one can’t help but wonder: do we really believe these banks will magically get their houses in working order? Or are we, once again, just bailing out the wealthy at the expense of the rest?


