Earn 7.12% on money sitting in your checking or savings account and hedge against inflation, risk-free, here’s how.

If you’re like me you probably have money sitting in your checking, savings, or money-market account. Paying practically zero interest and getting eaten alive by inflation. Here’s what you can do to earn 7.12% on that money and get inflation-adjusted returns on your excess cash.

Yield on savings and checking accounts are horrible

If you’re like me you’re probably trying to move your liquid funds around into these high-yield savings accounts which aren’t exactly keeping up with inflation. In fact, to date, the highest I can find is LendingClub at 0.60%

Inflation is a regressive tax on the poor and middle class

The annual inflation rate in the US has surged to 6.2% in October to 2021 according to the US Bureau of Labor and Statistics. This means your buying power is dropping significantly if you are holding on to cash. You of course know this if you have bought anything recently.

Use I bonds for risk-free inflation-adjusted return on your cash

To get the 7.12% yield you can buy I bonds which are backed by the United States government. They are inflation-adjusted. Meaning, you’re not technically building any wealth but you’re also not allowing the government to steal it through inflation. You can read more about how the rate is calculated here.

  • I bonds are an excellent investment rather than holding cash
  • They are exempt from state and local taxes
  • Subject to federal taxes.
  • Tax-deferred until you redeem them.
  • Mature in 30-years or until you redeem them
  • Redeemable after the first year of purchase
  • Early redemption is penalized with 3-months worth of interest
  • Interest is compounded every 6-months
  • Your money is locked up for a duration of 1-year

Historical I bond rates

Period when you bought
your I bond
Composite rate for your six-month earning period starting during November 2021 – April 2022
(See “When does my bond change rates?”)
FromThrough
Nov. 2021Apr. 20227.12%
May 2021Oct. 20217.12%
Nov. 2020Apr. 20217.12%
May 2020Oct. 20207.12%
Nov. 2019Apr. 20207.33%
May 2019Oct. 20197.64%
Nov. 2018Apr. 20197.64%
May 2018Oct. 20187.43%
Nov. 2017Apr. 20187.22%
May 2017Oct. 20177.12%
Nov. 2016Apr. 20177.12%
May 2016Oct. 20167.22%
Nov. 2015Apr. 20167.22%
May 2015Oct. 20157.12%
Nov. 2014Apr. 20157.12%
May 2014Oct. 20147.22%
Nov. 2013Apr. 20147.33%
May 2013Oct. 20137.12%
Nov. 2012Apr. 20137.12%
May 2012Oct. 20127.12%
Nov. 2011Apr. 20127.12%
May 2011Oct. 20117.12%
Nov. 2010Apr. 20117.12%
May 2010Oct. 20107.33%
Nov. 2009Apr. 20107.43%
May 2009Oct. 20097.22%
Nov. 2008Apr. 20097.84%
May 2008Oct. 20087.12%
Nov. 2007Apr. 20088.36%
May 2007Oct. 20078.47%
Nov. 2006Apr. 20078.57%
May 2006Oct. 20068.57%
Nov. 2005Apr. 20068.16%
May 2005Oct. 20058.36%
Nov. 2004Apr. 20058.16%
May 2004Oct. 20048.16%
Nov. 2003Apr. 20048.26%
May 2003Oct. 20038.26%
Nov. 2002Apr. 20038.78%
May 2002Oct. 20029.19%
Nov. 2001Apr. 20029.19%
May 2001Oct. 200110.23%
Nov. 2000Apr. 200110.64%
May 2000Oct. 200010.85%
Nov. 1999Apr. 200010.64%
May 1999Oct. 199910.54%
Nov. 1998Apr. 199910.54%
Sept. 1998Oct. 199810.64%

Here’s how you can buy I bonds

The first step is to sign up for a TreasuryDirect account which can be done here.
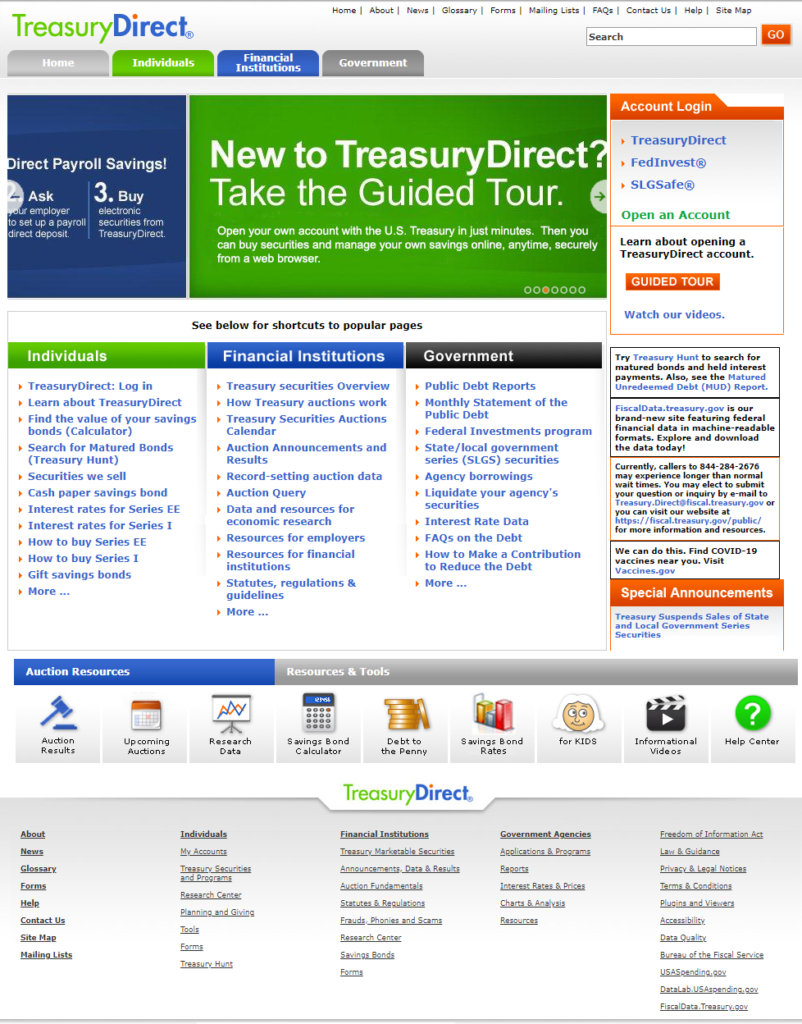
Once your account is set up you can log in here. You should have received your account number via email confirmation.

Once logged in you’ll see this screen.

Click on the BuyDirect option at the top. You’ll want to select series I bonds.

The most you can buy per social security number is $10,000/year

That’s it. Click submit.

And finally your confirmation page. Pretty simple and straightforward process.

Have kids?

If you have kids you can gift $10,000/year to them as well in I bonds. Read more on gifting I bonds here.

Want to purchase $5,000 more in I bonds every year?

You are also allowed to buy an additional $5,000 worth of I bonds every year with your tax return. That is of course if you have a tax return. You can do this by overpaying your taxes intentionally to the IRS via their website, here. I wouldn’t overpay by exactly $5,000 but probably an amount over. You can read more of the details on that process here. They are going to send you paper I bonds so you will want to convert them and attach them to your online account for ease of management. You buy I bonds with your tax return by submitting tax form 8888 with your taxes

Converting your I bonds to treasury direct electronic format

Directions on this process can be found on the treasury direct website, here.

You will need to create a conversion account one time.

You then need to create a registration list that matches the paper bond ownership that is printed on the paper bonds.

How to enable Python API in Interactive Brokers Trader Workstation

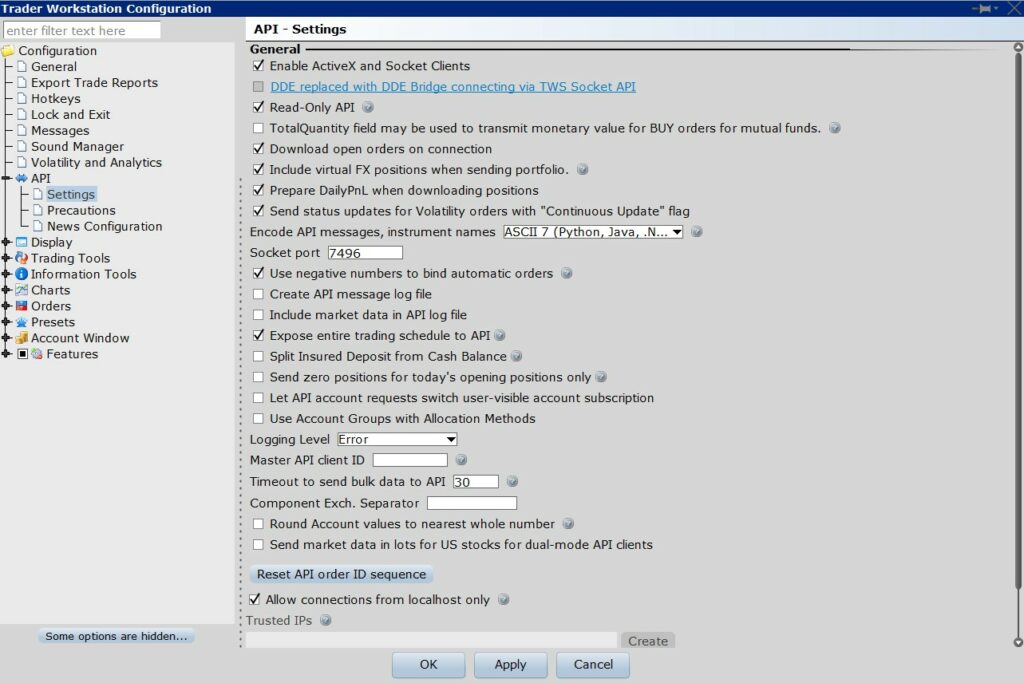
You’re going to want to open Interactive Brokers trader workstation as normal. Then head over to edit>Global Configuration and check that first box.

Enable ActiveX and Socket Clients

The next thing you’ll want to download is the API’s found here – http://interactivebrokers.github.io/

Next, open the command prompt as an administrator and switch directories where you installed it.

d:

D:\TWS API\source\pythonclient

python setup.py install

You will see this if it is completed successfully

Installed c:\program files\python39\lib\site-packages\ibapi-9.76.1-py3.9.egg
Processing dependencies for ibapi==9.76.1
Finished processing dependencies for ibapi==9.76.1

D:\TWS API\source\pythonclient>

I use IntelliJ to to test I’m going to run a simple command

import ibapi

You can see it ran successfully.

So let’s test a little further.

I’m going to run the following Python code

import ibapi

from ibapi.client import EClient
from ibapi.wrapper import EWrapper

class IBapi(EWrapper, EClient):
def __init__(self):
EClient.__init__(self, self)

app = IBapi()
app.connect('172.16.105.5', 7496, 123)


app.run()

import time
time.sleep(2)
app.disconnect()

This shows it was successful

“C:\Program Files\Python39\python.exe” “G:/My Drive/IdeaProjects/interactive_brokers/interactive_brokers_api_test.py”
ERROR -1 2104 Market data farm connection is OK:usfarm.nj
ERROR -1 2104 Market data farm connection is OK:cashfarm
ERROR -1 2104 Market data farm connection is OK:usfarm
ERROR -1 2106 HMDS data farm connection is OK:euhmds
ERROR -1 2106 HMDS data farm connection is OK:fundfarm
ERROR -1 2106 HMDS data farm connection is OK:ushmds
ERROR -1 2158 Sec-def data farm connection is OK:secdefnj

Shorting stocks to protect your home’s equity without selling your house

Almost everyone in the United States who owns a home has seen a massive increase in the equity of their house. In the Phoenix metro area, we have seen massive gains. For instance, a house I purchased 1-year ago has seen around a 50% increase in value. Today I was discussing with a friend his options for protecting his equity shorting housing stocks rather than selling his primary residence.

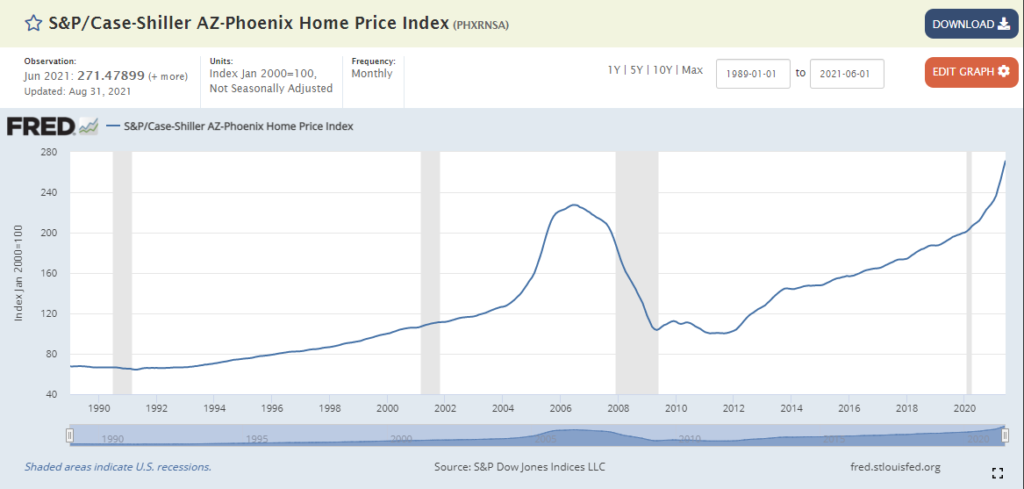
Let’s take a look at the Case-Shiller and Zillow estimates for our local Phoenix market.

Phoenix has been one of the hottest real estate markets over the last few years. In addition, we have seen a huge population increase in Arizona.


2020 Population
2010 Population+ People+ %
Utah3,271,6162,763,885507,73118.4
Idaho1,839,1061,567,582271,52417.3
Texas29,145,50525,145,5613,999,94415.9
North Dakota779,094672,591106,50315.8
Nevada3,104,6142,700,551404,06315
Colorado5,773,7145,029,196744,51814.8
District of Columbia689,545601,72387,82214.6
Florida21,538,18718,801,3102,736,87714.6
Washington7,705,2816,724,540980,74114.6
Arizona7,151,5026,392,017759,48511.9
South Carolina5,118,4254,625,364493,06110.7
Georgia10,711,9089,687,6531,024,25510.6
Oregon4,237,2563,831,074406,18210.6
Delaware989,948897,93492,01410.2

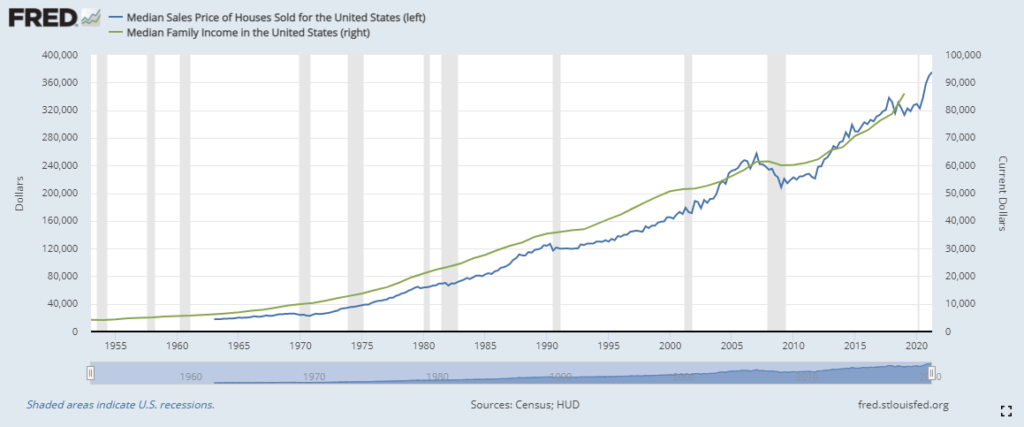
But are the prices high? I was to pause for a minute and look at the median sales price overlayed on the median family income. You have to normalize the price of a house. Given that people by houses a fair way to normalize this variable is to make it relative to the income of the average family or individual if you prefer.

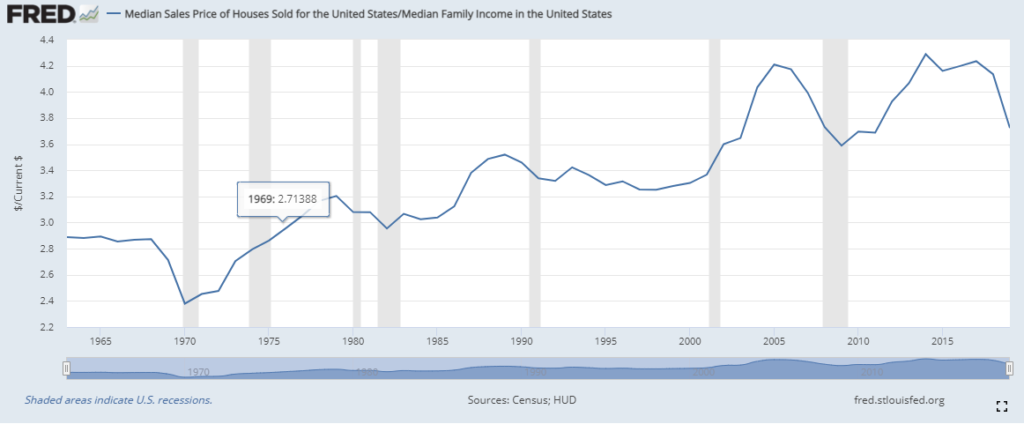
You can also use the median sales price of a house as the numerator and income as the denominator. This creates an oscillating indicator in which the peaks show the high price values and the troughs show the low price values. Do keep in mind this does not adjust for interest rates. This is a much more complicated formula so I won’t dive into this deeper. However, I do believe it is extremely relevant. Also, the data available on FRED isn’t updated to 2021 yet. So all of the appreciation we’ve seen in the last year or so is not accounted for in these charts. If I had to guess house prices are up significantly more than income.

I have heard a lot of people talk about selling their houses to capture the appreciation value because they “know” the prices will come back down. This is an extremely speculative comment but it’s one that I’ll entertain. In fact, I’ve thought about selling some houses as well. But know speculating with your primary residence is risky.

I want to outline some basic math here for anyone who is thinking about selling their house and the true cost. Let’s say you have a house that is now worth $400,000. You paid $200,000 initially. You now have $200,000 in equity. However, if you were to sell this house you’re looking at commissions for the buying and selling realtor plus miscellaneous fees. Let’s call this a total of 8%. It’s going to cost you roughly $32,000 to sell this house. Not to mention all of the other stress that comes with moving. This $32,000 represents almost 16% of your equity. You’re going to lose 16% of your equity if you make this move.

So let’s talk about creating a market-neutral position by short-selling residential construction companies in Arizona. I did not perform a comprehensive search for residential construction companies in Arizona. But I was able to pull up 6 publicly traded residential construction companies pretty quickly. Below you will find their 1-year return charts.

So let’s say you want to protect your $200,000 in equity as in the previous example. You could open short-sale positions in all of these stocks evenly. I highly recommended against short-selling one stock with any large percentage of your portfolio. The reason why is the downside loss is infinite. Short selling is extremely dangerous. The math for short selling these stocks is evenly balanced is pretty straightforward. You take your $200,000 and divide it by 6. This gives you $33,333 that you will want to short of each stock. You then take this number and divide it by the share price of the stock. In the last example, Toll Brothers is selling for $63.48. This would mean you would sell short 525 shares of this stock. So what we have essentially done here is make the determination that these stocks represent the value of house prices or that they have a high cointegration to house prices. Therefore if the housing prices go up you will lose money on your short and gain money on your house’s equity. Likewise, if housing prices go down you will make money on your short and lose money on your house’s equity. This puts you in what is called a market-neutral position. This occurs when you find highly cointegrated assets and place trades in opposite directions. Inherently you are long your house because you own it. So what we’re trying to accomplish is a short position equal to the value of your house. Or equal to the value of your equity.

There are also a few other techniques that I will not go into in this article.

  • I would recommend analyzing the short interest ratio of the stocks you plan on shorting. This is the open short interest divided by the daily trading volume.
  • Resaearch out of the money put options. This is a much cheaper way to make this bet with a limited downside risk. But options require a lot of effort and research.
  • Instead of short selling specific stocks you can short sell the entire residential construction industry through different ETFs like XHB, HOMZ, or PKB.

Delta Variant is Coming and I’m not Concerned.

If you look at the cases of the Delta variant of Covid coming out of the UK it looks alarming and it appears we’re getting ready to get another wave of Covid to shut down the world. But not so fast.

Let’s take a look at the hospitalization and the death rate.

Hospitalizations are clearly ticking up but clearly not with the velocity of the infection rate.

Death rate although lagging appears to be the same.

Pretty flat given what the first and second waves did to the UK.

One of two things are happening. Either A, the delta variant is not as deadly. Or B, the vaccinations are working.

But what about the kids? Kids or people under 20 haven’t really been impacted by Covid. Deaths aren’t a perfect summary of this. But they do give you an idea of the impact. You can extrapolate the hospitalizations based on these figures.

I would be concerned if I was elderly, had pre-existing conditions, or wasn’t vaccinated. Meaning I would still wear a mask and social distance. But outside of those parameters, this new variant does not appear to be nearly as deadly as the first for people who are vaccinated.